A laboratory weighs a reference mass 16 times and reports the average, \(10.3\) milligrams above nominal. A second laboratory repeats the procedure with the same instrument design and reports \(9.9\) . Neither has made an error. An average of 16 noisy readings is itself a noisy quantity, and two runs of the same procedure give two different numbers.
The practical question is how different. If averages of 16 readings typically vary by a few tenths of a milligram, the two reports agree; if they typically vary by a few hundredths, something is wrong with one of the laboratories. To answer, one needs the distribution of the average itself, over hypothetical repetitions of the whole procedure. That distribution is the subject of this chapter. It is also the hinge on which every inferential statement in later chapters turns: a confidence level, a significance level, and a standard error are all statements about the distribution of a statistic.
The chapter has a second purpose. A sampling distribution generally depends on the unknown parameter, which is awkward, since the parameter is what we do not have. In the best cases the data and the parameter can be combined into a quantity whose distribution is completely known. Such a quantity is called a pivot, and finding one is the classical route to exact inference.
2.1 The distribution of a statistic
Definition 2.1 (sampling distribution, standard error). Let \(T=T(X_1,\dots,X_n)\) be a statistic. Its sampling distribution under \(\theta\) is the distribution of the random variable \(T\) when the data have distribution \(P_\theta\) . The standard deviation of that distribution is the standard error of \(T\) .
The sampling distribution describes the procedure, not the particular data. It answers the question “if this experiment were run again and again under the law \(P_\theta\) , what values would the statistic take, and how often?” Only one run is ever observed. The others are hypothetical, and the model is what allows their distribution to be calculated.
Example 2.1: A sampling distribution by enumeration
A population consists of three equally likely values, \(1\) , \(2\) , and \(6\) . Its mean is \(\mu=3\) and its variance is \(\sigma^2=\tfrac13(4+1+9)=14/3\) . A random sample of size \(2\) is drawn, with replacement. There are nine equally likely ordered samples, and the sample mean takes the values
This table is the sampling distribution of \(\bar X\) . Its mean is \((1+3+2+7+8+6)/9=3\) , equal to \(\mu\) , and its variance works out to \(7/3\) , which is \(\sigma^2/2\) . The value \(3\) itself is never observed: no sample of size two has mean exactly equal to the population mean. The sampling distribution is centred on \(\mu\) without placing any mass there.
For a sample of size two, \(S^2=(X_1-X_2)^2/2\) . It takes the value \(0\) with probability \(3/9\) , and each of the values \(0.5\) , \(12.5\) , and \(8\) with probability \(2/9\) . Its mean is \((1+25+16)/9=14/3\) , equal to \(\sigma^2\) . The sample standard deviation \(S\) does not share this property: its mean is \(\tfrac29(\sqrt{0.5}+\sqrt{12.5}+\sqrt 8)\approx 1.571\) , well below \(\sigma=\sqrt{14/3}\approx 2.160\) .
The two equalities in the example hold for every population with a finite variance, and the proof uses only the algebra of expectation. Two imported facts are needed: expectation is linear, whether or not the variables are independent (math.probability-theory.expectation-linearity), and the variance of a sum of independent variables with finite variances is the sum of their variances (math.probability-theory.covariance-independence).
Theorem 2.2 (mean and variance of the sample mean and variance). Let \(X_1,\dots,X_n\) be a random sample from a distribution with mean \(\mu\) and finite variance \(\sigma^2\) , with \(n\ge 2\) . Then
Proof. Linearity gives \(E\,\bar X=\frac1n\sum E\,X_i=\mu\) . Independence gives \(\operatorname{Var}(\sum X_i)=n\sigma^2\) , and a constant factor \(1/n\) comes out of a variance squared, so \(\operatorname{Var}\bar X=\sigma^2/n\) . For the sample variance, expand about \(\mu\) :
which follows by writing \(X_i-\bar X=(X_i-\mu)-(\bar X-\mu)\) , squaring, and using \(\sum(X_i-\mu)=n(\bar X-\mu)\) . Taking expectations, the first sum contributes \(n\sigma^2\) and the second term contributes \(n\operatorname{Var}\bar X=\sigma^2\) . Hence \(E\sum(X_i-\bar X)^2=(n-1)\sigma^2\) , and dividing by \(n-1\) gives \(E\,S^2=\sigma^2\) .
The divisor \(n-1\) is explained by the proof: measuring deviations from \(\bar X\) instead of from \(\mu\) uses up one squared deviation’s worth of variability, because \(\bar X\) is fitted to the same data. The standard error of the mean, \(\sigma/\sqrt n\) , shrinks with the square root of the sample size. Quadrupling the data halves it.
Common mistake. Confusing the standard deviation of an observation with the standard error of the mean. The first, \(\sigma\) , describes how individual readings scatter and does not shrink as data accumulate. The second, \(\sigma/\sqrt n\) , describes how the average scatters over repetitions of the study. Reporting one where the other is meant misstates the uncertainty by a factor of \(\sqrt n\) .
Theorem 2.2 gives two moments of the sampling distribution and nothing more. To compute a probability such as \(P(\lvert\bar X-\mu\rvert>0.5)\) exactly, the whole distribution is needed, and that requires a model for the observations.
2.2 Samples from a normal distribution
For normal observations everything can be computed, and the results are the foundation of the \(t\) and \(F\) procedures. Three distributions are defined by how they arise.
Definition 2.3 (chi-square, Student t, and F distributions). Let \(Z,Z_1,\dots,Z_k\) be independent standard normal variables. The distribution of \(Z_1^2+\dots+Z_k^2\) is the chi-square distribution with \(k\) degrees of freedom, written \(\chi^2_k\) . If \(V\sim\chi^2_k\) is independent of \(Z\) , the distribution of \(Z/\sqrt{V/k}\) is the \(t\) distribution with \(k\) degrees of freedom, written \(t_k\) . If \(U\sim\chi^2_a\) and \(V\sim\chi^2_b\) are independent, the distribution of \((U/a)/(V/b)\) is the \(F\) distribution with \(a\) and \(b\) degrees of freedom, written \(F_{a,b}\) .
Since \(E\,Z^2=1\)
and \(E\,Z^4=3\)
, a \(\chi^2_k\)
variable has mean \(k\)
and variance \(2k\)
. A calculation with the change-of-variables formula for densities (math.probability-theory.density-transformation) identifies \(\chi^2_k\)
as the gamma distribution with shape \(k/2\)
and rate \(1/2\)
; that identification is used below but the definition by squares is what matters for the theory.
Lemma 2.4 (orthogonal invariance). Let \(Z=(Z_1,\dots,Z_n)^{\top}\) have independent standard normal components and let \(Q\) be an \(n\times n\) orthogonal matrix. Then the components of \(W=QZ\) are independent standard normal variables.
Proof. The joint density of \(Z\) is \((2\pi)^{-n/2}\exp(-\tfrac12\lVert z\rVert^2)\) . The map \(z\mapsto w=Qz\) is linear and invertible with inverse \(z=Q^{\top}w\) , and its Jacobian determinant is \(\det Q^{\top}=\pm 1\) . By the change-of-variables formula the density of \(W\) at \(w\) is the density of \(Z\) at \(Q^{\top}w\) times \(1\) . Orthogonal matrices preserve length, \(\lVert Q^{\top}w\rVert=\lVert w\rVert\) , so \(W\) has density \((2\pi)^{-n/2}\exp(-\tfrac12\lVert w\rVert^2)\) , which is the product of \(n\) standard normal densities.
Theorem 2.5 (sampling theory of a normal sample). Let \(X_1,\dots,X_n\) be a random sample from \(N(\mu,\sigma^2)\) with \(n\ge 2\) . Then
and \(\bar X\) and \(S^2\) are independent.
Proof. Put \(Z_i=(X_i-\mu)/\sigma\) , so the \(Z_i\) are independent standard normal. The vector \(u=(1/\sqrt n,\dots,1/\sqrt n)\) has length one, and it can be extended to an orthonormal basis of \(\mathbb R^n\) ; let \(Q\) be the orthogonal matrix whose first row is \(u\) and whose other rows are the remaining basis vectors. Put \(W=QZ\) . By Lemma 2.4 the \(W_i\) are independent standard normal. The first component is \(W_1=\sum Z_i/\sqrt n=\sqrt n\,\bar Z\) . Since \(Q\) preserves length, \(\sum_i W_i^2=\sum_i Z_i^2\) , and therefore
Now \(\bar X=\mu+\sigma\bar Z=\mu+\sigma W_1/\sqrt n\) is normal with mean \(\mu\) and variance \(\sigma^2/n\) , and \((n-1)S^2/\sigma^2=\sum(Z_i-\bar Z)^2=\sum_{i=2}^n W_i^2\) is a sum of \(n-1\) independent squared standard normals, hence \(\chi^2_{n-1}\) . The first is a function of \(W_1\) alone and the second of \((W_2,\dots,W_n)\) alone, so they are independent.
Independence of the sample mean and the sample variance is special to the normal family. In Example 2.1 it fails visibly: when \(S^2=0\) the two draws are equal and \(\bar X\) is \(1\) , \(2\) , or \(6\) , while when \(S^2=12.5\) the mean must be \(3.5\) .
Corollary 2.6 (the Studentized mean). Under the conditions of Theorem 2.5,
Proof. Write \(T=Z_0/\sqrt{V/(n-1)}\) with \(Z_0=\sqrt n(\bar X-\mu)/\sigma\) and \(V=(n-1)S^2/\sigma^2\) . By Theorem 2.5, \(Z_0\) is standard normal, \(V\sim\chi^2_{n-1}\) , and the two are independent. That is the definition of \(t_{n-1}\) ; the unknown \(\sigma\) has cancelled.
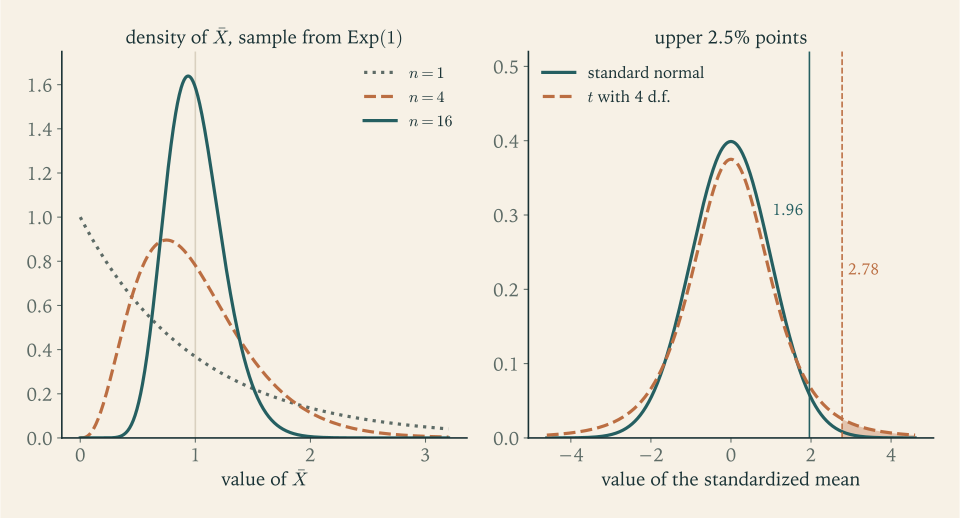
Replacing \(\sigma\) by its estimate \(S\) has a cost, and the \(t\) distribution measures it. The denominator is random, and when \(S\) happens to be small the ratio is large, so \(t_k\) has heavier tails than the standard normal. The upper \(2.5\%\) point is \(z_{0.025}=1.960\) for the normal, and it is \(2.776\) for \(t_4\) , \(2.262\) for \(t_9\) , \(2.064\) for \(t_{24}\) , and \(1.984\) for \(t_{99}\) . As the degrees of freedom grow, \(S\) becomes a precise estimate of \(\sigma\) and the \(t\) quantiles approach the normal ones.
Example 2.2: Sixteen weighings
Return to the laboratory, and suppose the 16 readings are a random sample from \(N(\mu,\sigma^2)\) .
How often is the average off by more than half a standard deviation? By Theorem 2.5, \(\sqrt{16}(\bar X-\mu)/\sigma\) is standard normal, so
How often does the sample variance overstate \(\sigma^2\) by half or more? Since \(15S^2/\sigma^2\sim\chi^2_{15}\) ,
And it understates by half or more with probability \(P(\chi^2_{15}<7.5)\approx 0.0577\) . A variance estimated from 16 observations is not precise: it overshoots by a factor of \(1.5\) or undershoots by a factor of \(2\) about 15% of the time.
What is lost by not knowing \(\sigma\) ? The quantity \(\sqrt{16}(\bar X-\mu)/S\) has the \(t_{15}\) distribution, whose upper \(2.5\%\) point is \(t_{15,0.025}\approx 2.131\) . Someone who used the normal cutoff \(1.96\) with \(S\) in place of \(\sigma\) would find \(P(\lvert T\rvert>1.96)\approx 0.0688\) instead of the intended \(0.05\) .
For the two laboratories of the opening, the difference of two independent means of 16 has standard error \(\sigma\sqrt{2/16}\approx 0.354\,\sigma\) . Whether \(10.3\) and \(9.9\) disagree depends on \(\sigma\) : if the instrument’s standard deviation is \(1\) milligram, a difference of \(0.4\) is about \(1.1\) standard errors and entirely ordinary.
2.3 Pivots
The variable \(\sqrt n(\bar X-\mu)/\sigma\) of Example 2.2 is not a statistic, since it involves \(\mu\) and \(\sigma\) . Its value is that its distribution is the same standard normal law for every \(\mu\) and \(\sigma\) .
Definition 2.7 (pivot). A pivot is a function \(Q(X,\theta)\) of the data and the parameter whose distribution under \(P_\theta\) is the same for every \(\theta\in\Theta\) .
A pivot packages the data and the unknown together in such a way that the uncertainty about the package is fully known. Once a pivot is in hand, any probability statement about it, such as \(P_\theta(a\le Q(X,\theta)\le b)=0.95\) , holds simultaneously for every \(\theta\) , and can be rearranged into a statement about where \(\theta\) lies relative to the data. Chapter 7 carries out that rearrangement. Here the task is to find pivots.
Theorem 2.5 and Corollary 2.6 supply three for the normal model: \(\sqrt n(\bar X-\mu)/\sigma\) , which is useful when \(\sigma\) is known; \(\sqrt n(\bar X-\mu)/S\) , which involves only \(\mu\) ; and \((n-1)S^2/\sigma^2\) , which involves only \(\sigma^2\) . That normal models yield pivots is no accident of the normal density. It comes from the location-scale structure.
Proposition 2.8 (pivots in location-scale families). Let \(X_i=\mu+\sigma Z_i\) for \(i=1,\dots,n\) , where \(Z_1,\dots,Z_n\) are a random sample from a known density \(f_0\) and \(n\ge 2\) . Then \((\bar X-\mu)/\sigma\) , \(S/\sigma\) , and \((\bar X-\mu)/S\) are pivots.
Proof. From \(X_i=\mu+\sigma Z_i\) it follows that \(\bar X=\mu+\sigma\bar Z\) and \(X_i-\bar X=\sigma(Z_i-\bar Z)\) , so \(S_X=\sigma S_Z\) , where \(S_Z\) is the sample standard deviation of the \(Z_i\) . Therefore
Each right-hand side is a function of \(Z_1,\dots,Z_n\) alone, and their joint distribution does not involve \(\mu\) or \(\sigma\) .
The proposition says that these quantities are pivots for any \(f_0\) . It does not say their distributions are normal, chi-square, or \(t\) ; that is true only when \(f_0\) is the standard normal density. For another \(f_0\) the distribution of \(\bar Z/S_Z\) is some other fixed law, which can be tabulated by numerical integration or by simulating samples from \(f_0\) .
Example 2.3: The largest of five uniform observations
Let \(X_1,\dots,X_5\) be a random sample from the uniform distribution on \((0,\theta)\) , and let \(M=\max_i X_i\) . This is a scale family, so \(M/\theta\) should be a pivot, and its distribution can be found directly. For \(0\le u\le 1\) , the event \(M\le u\theta\) occurs exactly when all five observations are at most \(u\theta\) , each of which has probability \(u\) :
No \(\theta\) appears on the right. Three consequences follow. The maximum falls below \(80\%\) of \(\theta\) with probability \(0.8^5\approx 0.328\) . The median of \(M/\theta\) is \(0.5^{1/5}\approx 0.871\) , so the maximum typically undershoots \(\theta\) by about \(13\%\) . And \(P(M/\theta\le u)=0.05\) at \(u=0.05^{1/5}\approx 0.549\) , so with probability \(0.95\) the maximum is at least \(54.9\%\) of \(\theta\) . The density of \(M/\theta\) is \(5u^4\) on \((0,1)\) , with mean \(5/6\) ; the maximum is a biased estimator of \(\theta\) , a point Chapter 4 takes up.
Example 2.4: Total lifetime in an exponential sample
Let \(X_1,\dots,X_{10}\) be a random sample of lifetimes from \(\operatorname{Exp}(\lambda)\) . Each \(\lambda X_i\) has the \(\operatorname{Exp}(1)\) distribution, so \(\lambda\sum X_i\) is a sum of ten independent \(\operatorname{Exp}(1)\) variables, which is \(\operatorname{Gamma}(10,1)\) . Doubling it gives a gamma distribution with shape \(10\) and rate \(1/2\) , and that is \(\chi^2_{20}\) . Hence
a pivot. For instance, the probability that the sample mean exceeds one and a half times the true mean lifetime \(1/\lambda\) is
whatever \(\lambda\) is. The central 95% range of the pivot is from \(9.591\) to \(34.170\) , the lower and upper \(2.5\%\) points of \(\chi^2_{20}\) ; note how unsymmetric this range is about the mean \(20\) .
2.4 Order statistics and pivots that need no model
Write \(X_{(1)}\le X_{(2)}\le\dots\le X_{(n)}\) for the sample arranged in increasing order. These are the order statistics; the minimum is \(X_{(1)}\) , the maximum is \(X_{(n)}\) , and the sample median is the middle one when \(n\) is odd.
Proposition 2.9 (distribution of an order statistic). Let \(X_1,\dots,X_n\) be a random sample with distribution function \(F\) . Then for \(1\le k\le n\) ,
If \(F\) has density \(f\) , then \(X_{(k)}\) has density
Proof. The event \(X_{(k)}\le x\) says that at least \(k\) of the observations are at most \(x\) . The number of observations that are at most \(x\) is binomial with \(n\) trials and success probability \(F(x)\) , by Proposition 1.5, and the first formula is the probability that this count is \(k\) or more. For the density, differentiate with respect to \(x\) . The derivative of the \(j\) -th term is
Using \((n-j)\binom nj=(j+1)\binom n{j+1}\) , the negative part of the \(j\) -th term cancels the positive part of the \((j+1)\) -th. The sum telescopes, the last negative part vanishes because \(n-j=0\) at \(j=n\) , and what remains is the positive part of the term \(j=k\) , which is \(k\binom nk F^{k-1}(1-F)^{n-k}f\) .
For a parametric family the proposition gives the sampling distribution of any order statistic. Its more surprising use is in models with no parametric form at all.
Proposition 2.10 (probability integral transform). If \(X\) has a continuous distribution function \(F\) , then \(F(X)\) is uniformly distributed on \((0,1)\) .
Proof. Fix \(u\in(0,1)\) and let \(x_u=\sup\{x:F(x)\le u\}\) . Continuity of \(F\) gives \(F(x_u)=u\) . If \(X\le x_u\) then \(F(X)\le F(x_u)=u\) because \(F\) is nondecreasing, and if \(X>x_u\) then \(F(X)>u\) by the definition of the supremum. So the events \(F(X)\le u\) and \(X\le x_u\) coincide, and \(P(F(X)\le u)=F(x_u)=u\) .
In the nonparametric model “random sample from a continuous \(F\) ”, the quantity \(F(X_i)\) is a pivot: it involves the unknown \(F\) , and its distribution is uniform whatever \(F\) is. So is the number of observations below any fixed quantile of \(F\) . Chapter 13 uses the same transform to check whether a forecaster’s predictive distributions are calibrated.
Example 2.5: Bracketing a median without a model
Let \(X_1,\dots,X_6\) be a random sample from a continuous distribution with median \(m\) , so that each observation falls below \(m\) with probability exactly \(1/2\) . The number \(B\) of observations below \(m\) is binomial with \(6\) trials and success probability \(1/2\) , whatever the distribution is. The interval from the smallest to the largest observation fails to contain \(m\) only when all six fall on one side:
The narrower interval from the second smallest to the second largest contains \(m\) when \(2\le B\le 4\) :
These probabilities were computed without knowing anything about the shape of the distribution. With six observations one can be about \(97\%\) sure that the range brackets the median, and that statement is exact for skewed, heavy-tailed, and multimodal populations alike.
2.5 When the exact distribution is out of reach
For most statistics and most models no pivot with a tabulated distribution exists. The fallback is an approximation valid for large samples. The fundamental one is the Central Limit Theorem: if \(X_1,X_2,\dots\)
are independent and identically distributed with mean \(\mu\)
and finite positive variance \(\sigma^2\)
, then \(\sqrt n(\bar X-\mu)/\sigma\)
converges in distribution to the standard normal (math.probability-theory.central-limit-theorem). In the language of this chapter, \(\sqrt n(\bar X-\mu)/\sigma\)
is an approximate pivot in any model with finite variance. The left panel of Figure 2.1 shows the approximation forming: the mean of exponential observations has a skewed distribution for \(n=4\)
and a nearly symmetric bell shape for \(n=16\)
.
The theorem is a limit statement and carries no guarantee at a given \(n\) . How large \(n\) must be depends on how far the population is from normal, chiefly on its skewness and on the weight of its tails, and the quality of the approximation is usually worst in the tails of the sampling distribution, which is where inference uses it.
Example 2.6: A proportion, exactly and approximately
Let \(X\sim\operatorname{Binomial}(100,0.3)\) and let \(\hat p=X/100\) be the sample proportion, with mean \(0.3\) and standard error \(\sqrt{0.3\times 0.7/100}\approx 0.0458\) . The exact probability that the proportion is at most \(0.25\) is
The normal approximation applied naively gives \(\Phi\bigl((0.25-0.3)/0.0458\bigr)=\Phi(-1.091)\approx 0.1376\) , an error of about \(0.026\) . The discrepancy is mostly a matter of discreteness: \(X\) takes integer values, and the event \(X\le 25\) is the same as \(X<26\) . Splitting the difference and using \(25.5\) gives \(\Phi\bigl((25.5-30)/\sqrt{21}\bigr)=\Phi(-0.982)\approx 0.1631\) , correct to four decimals. For the mean of ten \(\operatorname{Exp}(1)\) lifetimes, by contrast, the exact tail probability of Example 2.4 is \(0.0699\) and the normal approximation \(1-\Phi(0.5\sqrt{10})\) gives \(0.0569\) ; here the error comes from skewness and no simple correction removes it.
Three routes to a sampling distribution have now appeared: exact enumeration or calculation, as in Examples 2.1 to 2.5; a limit theorem, as in Example 2.6; and simulation, in which one generates many samples from \(P_\theta\) on a computer and tabulates the statistic. Simulation is an approximation to an exact answer and its error can be made as small as patience allows, but it requires a fully specified law to simulate from, so it is most useful for pivots, whose law does not depend on the unknown.
The sampling distribution of a statistic depends on the whole sample only through the statistic. The next chapter asks the complementary question: which statistics retain everything the sample has to say about the parameter, so that nothing is lost by computing them and discarding the rest?
Exercises
-
For the population \(\{1,2,6\}\) and samples of size two of Example 2.1, tabulate the sampling distribution of the sample maximum, compute its mean, and compare the mean with the population maximum.
Answer
The maximum equals \(1\) with probability \(1/9\) , equals \(2\) with probability \(3/9\) , and equals \(6\) with probability \(5/9\) . Its mean is \((1+6+30)/9=37/9\approx 4.11\) , below the population maximum \(6\) : a sample maximum can never exceed the population maximum and sometimes falls short.
-
A random sample of size \(36\) is taken from a normal population with \(\sigma=12\) . Compute the standard error of \(\bar X\) , the probability that \(\bar X\) lies within \(3\) of \(\mu\) , and the smallest sample size for which that probability is at least \(0.95\) .
Answer
Standard error \(12/\sqrt{36}=2\) . \(P(\lvert\bar X-\mu\rvert\le 3)=2\Phi(1.5)-1\approx 0.8664\) . The requirement \(3\sqrt n/12\ge 1.960\) gives \(n\ge 61.5\) , so \(n=62\) .
-
Let \(X_1,\dots,X_n\) be a random sample from any distribution with finite variance. Prove that \(\operatorname{Cov}(\bar X,X_i-\bar X)=0\) for each \(i\) , and explain, with reference to Example 2.1, why this does not make \(\bar X\) and \(S^2\) independent.
Solution
By bilinearity of covariance, \(\operatorname{Cov}(\bar X,X_i-\bar X)=\operatorname{Cov}(\bar X,X_i)-\operatorname{Var}\bar X\) . Since \(\bar X=\frac1n\sum_j X_j\) and the observations are independent, only the term \(j=i\) contributes to the first covariance: \(\operatorname{Cov}(\bar X,X_i)=\frac1n\operatorname{Var}X_i=\sigma^2/n\) . By Theorem 2.2, \(\operatorname{Var}\bar X=\sigma^2/n\) as well, so the difference is zero.
Zero covariance says only that there is no linear association between \(\bar X\) and each residual \(X_i-\bar X\) . The sample variance is a quadratic function of the residuals, and quadratic functions of uncorrelated variables can depend strongly on one another. In Example 2.1 the event \(S^2=0\) has probability \(1/3\) and the event \(\bar X=3.5\) has probability \(2/9\) , yet they cannot occur together, so \(P(S^2=0,\ \bar X=3.5)=0\ne\tfrac13\cdot\tfrac29\) . For normal samples the vector of \(\bar X\) and the residuals is jointly normal, and for jointly normal variables zero covariance does imply independence; that is another route to the independence statement in Theorem 2.5.
-
For a random sample of size \(10\) from a normal distribution, compute \(P(S^2\le 0.5\,\sigma^2)\) and find the constant \(c\) with \(P(S^2>c\,\sigma^2)=0.05\) .
Answer
\(P(S^2\le 0.5\sigma^2)=P(\chi^2_9\le 4.5)\approx 0.1245\) . For the second part, \(9c=\chi^2_{9,0.05}\approx 16.919\) , so \(c\approx 1.880\) .
-
Prove that \(E\,S\le\sigma\) for every random sample from a distribution with finite variance, with strict inequality unless \(S\) is constant with probability one, and compute \(E\,S/\sigma\) exactly for a normal sample of size \(2\) .
Solution
For any random variable with a finite second moment, \(\operatorname{Var}(S)=E\,S^2-(E\,S)^2\ge 0\) , with equality exactly when \(S\) is constant with probability one. By Theorem 2.2, \(E\,S^2=\sigma^2\) . Hence \((E\,S)^2\le\sigma^2\) , and since \(S\ge 0\) this gives \(E\,S\le\sigma\) , with strict inequality unless \(S\) is almost surely constant. The square root is a concave function, and the result is an instance of Jensen’s inequality, stated in Section 4.5: the expectation of a concave function of a variable is at most the function of the expectation.
For a normal sample of size \(2\) , \(S^2=(X_1-X_2)^2/2\) , so \(S=\lvert X_1-X_2\rvert/\sqrt2\) . The difference \(X_1-X_2\) is \(N(0,2\sigma^2)\) , and the mean absolute value of a \(N(0,\tau^2)\) variable is \(\tau\sqrt{2/\pi}\) . With \(\tau=\sigma\sqrt2\) ,
\[ E\,S=\frac{\sigma\sqrt2\,\sqrt{2/\pi}}{\sqrt2}=\sigma\sqrt{\frac{2}{\pi}}\approx 0.798\,\sigma . \]With two observations the sample standard deviation underestimates \(\sigma\) by about \(20\%\) on average, even though \(S^2\) is exactly unbiased for \(\sigma^2\) .
-
Let \(X_1,\dots,X_m\) and \(Y_1,\dots,Y_n\) be independent random samples from \(N(\mu_1,\sigma^2)\) and \(N(\mu_2,\sigma^2)\) with a common unknown variance, and let \(S_p^2=\bigl((m-1)S_X^2+(n-1)S_Y^2\bigr)/(m+n-2)\) . Prove that \(\bigl(\bar X-\bar Y-(\mu_1-\mu_2)\bigr)/\bigl(S_p\sqrt{1/m+1/n}\bigr)\) has the \(t_{m+n-2}\) distribution.
Solution
Apply Theorem 2.5 to each sample. First, \(\bar X\sim N(\mu_1,\sigma^2/m)\) and \(\bar Y\sim N(\mu_2,\sigma^2/n)\) are independent, so
\[ Z_0=\frac{\bar X-\bar Y-(\mu_1-\mu_2)}{\sigma\sqrt{1/m+1/n}}\sim N(0,1). \]Second, \((m-1)S_X^2/\sigma^2\sim\chi^2_{m-1}\) and \((n-1)S_Y^2/\sigma^2\sim\chi^2_{n-1}\) are independent, being functions of different samples. A sum of independent chi-square variables is chi-square with the degrees of freedom added, directly from Definition 2.3, so
\[ V=\frac{(m+n-2)S_p^2}{\sigma^2}=\frac{(m-1)S_X^2+(n-1)S_Y^2}{\sigma^2}\sim\chi^2_{m+n-2}. \]Third, \(Z_0\) is independent of \(V\) : within each sample the mean is independent of the variance by Theorem 2.5, and the two samples are independent of each other, so the pair \((\bar X,\bar Y)\) is independent of the pair \((S_X^2,S_Y^2)\) . By the definition of the \(t\) distribution,
\[ \frac{Z_0}{\sqrt{V/(m+n-2)}}=\frac{\bar X-\bar Y-(\mu_1-\mu_2)}{S_p\sqrt{1/m+1/n}}\sim t_{m+n-2}, \]the common \(\sigma\) having cancelled. The equal-variance assumption is what makes the cancellation possible.
-
Two independent normal samples of size \(10\) have variances \(\sigma_1^2\) and \(\sigma_2^2\) . Find a pivot involving only the ratio \(\sigma_1^2/\sigma_2^2\) , name its distribution, and compute the probability that \(S_1^2/S_2^2\) exceeds \(2.5\) when the two population variances are equal.
Answer
\((S_1^2/\sigma_1^2)/(S_2^2/\sigma_2^2)\sim F_{9,9}\) , a pivot involving only \(\sigma_1^2/\sigma_2^2\) . With equal variances, \(P(S_1^2/S_2^2>2.5)=P(F_{9,9}>2.5)\approx 0.0942\) .
-
In the model \(N(\mu,\sigma^2)\) with both parameters unknown, decide which of the following are pivots and justify each answer from Theorem 2.5 or Proposition 2.8: (a) \(\bar X-\mu\) ; (b) \((\bar X-\mu)/S\) ; (c) \(S^2/\sigma^2\) ; (d) \(\bar X/S\) .
Answer
(a) Not a pivot: its distribution \(N(0,\sigma^2/n)\) depends on \(\sigma\) . (b) A pivot: \(\sqrt n\) times it is \(t_{n-1}\) . (c) A pivot: \((n-1)\) times it is \(\chi^2_{n-1}\) . (d) Not a pivot: it is a statistic, and its distribution depends on \(\mu/\sigma\) .
-
Let \(M\) be the maximum of a random sample of size \(n\) from the uniform distribution on \((0,\theta)\) . (a) For \(n=8\) find \(a\) with \(P_\theta(a\le M/\theta\le 1)=0.95\) . (b) Show that \(n(1-M/\theta)\) converges in distribution to \(\operatorname{Exp}(1)\) as \(n\to\infty\) , and contrast the rate \(n\) with the rate \(\sqrt n\) of the Central Limit Theorem.
Solution
(a) As in Example 2.3, \(P_\theta(M/\theta\le u)=u^n\) for \(0\le u\le 1\) . With \(n=8\) , the requirement \(P(a\le M/\theta\le 1)=1-a^8=0.95\) gives \(a=0.05^{1/8}\approx 0.6877\) .
(b) Fix \(t\ge 0\) . For \(n>t\) ,
\[ P_\theta\bigl(n(1-M/\theta)>t\bigr)=P_\theta\Bigl(\frac M\theta<1-\frac tn\Bigr)=\Bigl(1-\frac tn\Bigr)^n\longrightarrow e^{-t}, \]which is the probability that an \(\operatorname{Exp}(1)\) variable exceeds \(t\) . Since the limit function is continuous, this is convergence in distribution.
The scaling is by \(n\) , not \(\sqrt n\) . In the Central Limit Theorem the error \(\bar X-\mu\) is of order \(1/\sqrt n\) and its limit is normal. Here the error \(\theta-M\) is of order \(1/n\) , much smaller, and its limit is exponential, a one-sided skewed law, because the maximum can only undershoot. The uniform model has a boundary that moves with the parameter, and statistics that sit at the boundary are governed by different asymptotics from averages.
-
For a random sample of size \(n\) from \(\operatorname{Exp}(\lambda)\) , find the distribution of the minimum \(X_{(1)}\) , show that \(n\lambda X_{(1)}\) is a pivot, and explain why the pivot \(2\lambda\sum X_i\) of Example 2.4 is nevertheless preferred.
Hint
\(P(X_{(1)}>x)=P(\text{all } X_i>x)=e^{-n\lambda x}\) , so \(X_{(1)}\sim\operatorname{Exp}(n\lambda)\) and \(n\lambda X_{(1)}\sim\operatorname{Exp}(1)\) . Compare relative spread: the \(\operatorname{Exp}(1)\) pivot has standard deviation equal to its mean for every \(n\) , while \(\chi^2_{2n}\) has standard deviation \(2\sqrt n\) against mean \(2n\) . Which pivot pins \(\lambda\) down more tightly as \(n\) grows?
-
A report states: “Each measurement is \(N(\mu,\sigma^2)\) , so 95% of sample means of 25 measurements fall within \(\mu\pm 1.96\,\sigma\) .” Find the error, state the correct interval, and compute the actual probability that a mean of 25 falls within \(\mu\pm 1.96\,\sigma\) .
Solution
The error is the use of \(\sigma\) , the standard deviation of a single measurement, where the standard error of the mean is required. By Theorem 2.5 the mean of 25 measurements is \(N(\mu,\sigma^2/25)\) , with standard error \(\sigma/5\) . The interval that contains \(95\%\) of sample means is
\[ \mu\pm 1.96\,\frac{\sigma}{5}=\mu\pm 0.392\,\sigma . \]The interval in the report, \(\mu\pm 1.96\,\sigma\) , is five times too wide. In units of the standard error its half-width is \(1.96\times 5=9.8\) , so the probability that a mean of 25 falls inside it is \(P(\lvert Z\rvert<9.8)\) , which differs from \(1\) by about \(10^{-22}\) . The statement in the report is therefore not false as a lower bound, but as a description of the variability of means it overstates the spread by a factor of five; the interval \(\mu\pm1.96\sigma\) describes individual measurements, not their averages.
-
A student with a normal sample of size \(5\) and unknown variance uses the cutoff \(1.96\) for \(\sqrt 5(\bar X-\mu)/S\) . Compute the actual probability that this quantity lies between \(-1.96\) and \(1.96\) , and give the cutoff that achieves probability \(0.95\) .
Solution
By Corollary 2.6, \(T=\sqrt5(\bar X-\mu)/S\) has the \(t_4\) distribution. The probability that \(T\) lies between \(-1.96\) and \(1.96\) is
\[ 1-2P(t_4>1.96)\approx 0.8784 . \]So an interval or test built with the normal cutoff has an actual error rate of about \(12.2\%\) where \(5\%\) was intended, more than twice the nominal rate. The cutoff that gives probability \(0.95\) is the upper \(2.5\%\) point of \(t_4\) , namely \(t_{4,0.025}\approx 2.776\) . The difference between \(1.96\) and \(2.776\) is the price of estimating \(\sigma\) from five observations: the denominator \(S\) has only four degrees of freedom and is frequently much smaller than \(\sigma\) , which inflates the ratio.
-
For a random sample of size \(5\) from the uniform distribution on \((0,1)\) , find the density of the sample median, verify that it integrates to one, and compare the variance of the median with the variance of the sample mean.
Solution
For the uniform distribution on \((0,1)\) , \(F(x)=x\) and \(f(x)=1\) . The median of five is the third order statistic, so by Proposition 2.9 with \(n=5\) and \(k=3\) ,
\[ f_{(3)}(x)=\frac{5!}{2!\,2!}x^2(1-x)^2=30x^2(1-x)^2,\qquad 0<x<1 . \]Expanding, \(30\int_0^1(x^2-2x^3+x^4)\,dx=30\bigl(\tfrac13-\tfrac12+\tfrac15\bigr)=30\cdot\tfrac1{30}=1\) . The density is symmetric about \(1/2\) , so the mean is \(1/2\) . The second moment is \(30\int_0^1(x^4-2x^5+x^6)\,dx=30\bigl(\tfrac15-\tfrac13+\tfrac17\bigr)=\tfrac{2}{7}\) , and the variance is \(\tfrac27-\tfrac14=\tfrac1{28}\approx 0.0357\) .
The sample mean has variance \(\sigma^2/5=(1/12)/5=1/60\approx 0.0167\) . For uniform data the mean is the more precise estimator of the centre, by a factor of \(60/28\approx 2.1\) in variance. For heavy-tailed populations the comparison reverses, which is why the choice between mean and median depends on the model.
-
For a random sample of size \(10\) from a continuous distribution with median \(m\) , compute \(P(X_{(2)}<m<X_{(9)})\) and explain why the answer does not depend on the distribution.
Answer
The interval misses \(m\) when at most one or at least nine of the ten observations lie below \(m\) . With \(B\sim\operatorname{Binomial}(10,1/2)\) , the probability is \(1-2P(B\le 1)=1-2\cdot\tfrac{11}{1024}\approx 0.9785\) . Only the fact that each observation falls below \(m\) with probability \(1/2\) was used.
-
Show by an explicit example that Proposition 2.10 fails when \(F\) is not continuous, and identify the step of the proof that breaks.
Hint
Take \(X\) equal to \(0\) or \(1\) with probability \(1/2\) each. Then \(F(X)\) takes only the values \(1/2\) and \(1\) . In the proof, look at the claim \(F(x_u)=u\) for \(u=0.3\) .
-
Let \(X_1,\dots,X_{50}\) be a random sample from the Poisson distribution with mean \(2\) . Compute \(P(\bar X\ge 2.4)\) exactly, using the fact that a sum of independent Poisson variables is Poisson, and compare it with the normal approximation with and without a continuity correction.
Answer
\(\sum X_i\sim\operatorname{Poisson}(100)\) and \(\bar X\ge 2.4\) means \(\sum X_i\ge 120\) . Exact: \(\approx 0.0282\) . Normal without correction: \(1-\Phi(2)\approx 0.0228\) . With continuity correction: \(1-\Phi(1.95)\approx 0.0256\) . The correction removes about half the error; the rest is skewness.
-
Prove the identity \(\sum_{i=1}^n (X_i-\bar X)^2=\frac{1}{2n}\sum_{i=1}^n\sum_{j=1}^n (X_i-X_j)^2\) , and use it to give a second proof that \(E\,S^2=\sigma^2\) which never mentions \(\mu\) .
Solution
Write \(X_i-X_j=(X_i-\bar X)-(X_j-\bar X)\) and expand the square:
\[ \sum_{i}\sum_{j}(X_i-X_j)^2=\sum_i\sum_j (X_i-\bar X)^2+\sum_i\sum_j (X_j-\bar X)^2-2\sum_i (X_i-\bar X)\sum_j (X_j-\bar X). \]Each of the first two double sums equals \(n\sum_i (X_i-\bar X)^2\) , and the last term is zero because \(\sum_i (X_i-\bar X)=0\) . Hence the double sum equals \(2n\sum_i (X_i-\bar X)^2\) , which is the identity.
For the expectation: when \(i=j\) the term \((X_i-X_j)^2\) is zero. When \(i\ne j\) , \(X_i-X_j\) has mean zero and, by independence, variance \(2\sigma^2\) , so \(E(X_i-X_j)^2=2\sigma^2\) . There are \(n(n-1)\) ordered pairs with \(i\ne j\) . Therefore
\[ E\sum_i (X_i-\bar X)^2=\frac{1}{2n}\cdot n(n-1)\cdot 2\sigma^2=(n-1)\sigma^2, \]and dividing by \(n-1\) gives \(E\,S^2=\sigma^2\) . The population mean never entered: \(S^2\) is the average over pairs of half the squared difference, and each pair on its own is an unbiased estimate of \(\sigma^2\) .
-
A sample of size \(n\) is drawn without replacement from a finite population of \(N\) values with mean \(\mu\) and variance \(\sigma^2=\frac1N\sum_k (v_k-\mu)^2\) , as in Example 1.5. Show that \(\operatorname{Cov}(X_i,X_j)=-\sigma^2/(N-1)\) for \(i\ne j\) and deduce that \(\operatorname{Var}\bar X=\frac{\sigma^2}{n}\cdot\frac{N-n}{N-1}\) .
Hint
Each \(X_i\) is marginally uniform on the population, so \(\operatorname{Var}X_i=\sigma^2\) . If \(n=N\) the sum \(\sum X_i\) is the population total, a constant, so its variance is zero: \(0=N\sigma^2+N(N-1)c\) where \(c\) is the common covariance. Solve for \(c\) , then expand \(\operatorname{Var}(\sum_{i\le n}X_i)=n\sigma^2+n(n-1)c\) .
-
Let \(X_i=\mu+\sigma Z_i\) where the \(Z_i\) are a random sample from the Laplace density \(\tfrac12e^{-\lvert z\rvert}\) . Explain why \(\sqrt n(\bar X-\mu)/S\) is a pivot but does not have a \(t\) distribution, and describe a procedure for obtaining its upper \(2.5\%\) point for \(n=5\) .
Hint
Proposition 2.8 applies with \(f_0\) the Laplace density, so the quantity is a pivot. Corollary 2.6 needs normality, which fails. Generate many samples of five from the standard Laplace density, compute \(\sqrt5\,\bar Z/S_Z\) for each, and take the empirical \(97.5\%\) point; the simulation is legitimate because the law of the pivot involves no unknowns.