Chapters 4 and 5 left a simple recipe for a better rocket: make the exhaust hotter, make it lighter, and expand it through a bigger pressure ratio. Hydrogen and oxygen give an ideal vacuum exhaust velocity of \(4462\ \mathrm{m/s}\) against \(3510\ \mathrm{m/s}\) for kerosene and oxygen (Wikipedia, “Liquid rocket propellant”; see sources). The RD-180 runs its chamber at \(26.7\ \mathrm{MPa}\) and the Merlin at \(9.7\ \mathrm{MPa}\) (secondary compilation; see sources). If lighter and higher are better, why does anyone build a kerosene first stage, and why is the reference launcher’s chamber at a modest \(10\ \mathrm{MPa}\) ?
The answer is that every one of those improvements is paid for in hardware. A light exhaust comes from a propellant so thin that its tanks become enormous. High chamber pressure has to be supplied by pumps, and the pumps have to be driven by something. A hot chamber has to be kept from melting. Each cost can be estimated with the tools already in hand: the steady-flow energy equation, the ideal-gas relations, and a little statics. Doing so produces the two numbers that Chapter 2 simply assumed, the specific impulse and the structural coefficient, and shows what they are made of. This chapter stays at the level of energy and mass balances. How pumps, injectors, and cooling passages are actually designed is outside the course.
6.1 A propellant pair is two numbers, not one
The rocket equation sees a propellant only through its exhaust velocity. The vehicle also has to hold the propellant, and for that what matters is how much room a kilogram takes up.
A liquid engine burns a fuel and an oxidizer in a fixed proportion by mass, the mixture ratio \(\mathrm{O/F}\) . If the fuel has density \(\rho_{\mathrm{fuel}}\) and the oxidizer \(\rho_{\mathrm{ox}}\) , then \(1\ \mathrm{kg}\) of fuel and \(\mathrm{O/F}\) kilograms of oxidizer occupy \(1/\rho_{\mathrm{fuel}}+(\mathrm{O/F})/\rho_{\mathrm{ox}}\) cubic metres between them.
Definition 6.1 (bulk density and density impulse). The bulk density of a propellant pair at mixture ratio \(\mathrm{O/F}\) is the total propellant mass divided by the total tank volume it needs,
The density impulse is the product \(\rho_{\mathrm{bulk}}\,I_{sp}\) , the impulse delivered per unit of tank volume divided by \(g_0\) , in \(\mathrm{kg\cdot s/m^3}\) .
Bulk density is a mass-weighted harmonic mean, so the thinner liquid dominates it. Four pairs show the range. The values are ideal calculations for a chamber at \(6.9\ \mathrm{MPa}\) , at the mixture ratio that maximizes exhaust velocity in each case (Wikipedia, “Liquid rocket propellant”, tabulating published thermochemical results; see sources).
| Propellant pair | Sea level: \(\mathrm{O/F}\) , exhaust velocity | Vacuum, area ratio 40: \(\mathrm{O/F}\) , exhaust velocity | Chamber temperature | Bulk density | \(c^\ast\) |
|---|---|---|---|---|---|
| Hydrogen and oxygen | \(4.13\) , \(3816\ \mathrm{m/s}\) | \(4.83\) , \(4462\ \mathrm{m/s}\) | \(3013\ \mathrm K\) | \(290\ \mathrm{kg/m^3}\) | \(2416\ \mathrm{m/s}\) |
| Methane and oxygen | \(3.21\) , \(3034\ \mathrm{m/s}\) | \(3.45\) , \(3615\ \mathrm{m/s}\) | \(3533\ \mathrm K\) | \(820\ \mathrm{kg/m^3}\) | \(1857\ \mathrm{m/s}\) |
| Kerosene and oxygen | \(2.58\) , \(2941\ \mathrm{m/s}\) | \(2.77\) , \(3510\ \mathrm{m/s}\) | \(3676\ \mathrm K\) | \(1030\ \mathrm{kg/m^3}\) | \(1799\ \mathrm{m/s}\) |
| Storable pair | \(2.17\) , \(2827\ \mathrm{m/s}\) | \(2.37\) , \(3347\ \mathrm{m/s}\) | \(3395\ \mathrm K\) | \(1190\ \mathrm{kg/m^3}\) | \(1745\ \mathrm{m/s}\) |
Temperature, density, and \(c^\ast\) are the sea-level-optimum values. The storable pair is monomethylhydrazine with nitrogen tetroxide, liquids that keep at room temperature and ignite on contact, used where a stage must wait for months or restart many times.
Read down the table and the trade is plain. Exhaust velocity falls from hydrogen to the storable pair by a quarter. Bulk density rises by a factor of four. Hydrogen’s advantage is the molar mass of its exhaust, as Chapter 4 explained; its penalty is that liquid hydrogen has a density of \(70.85\ \mathrm{kg/m^3}\) , one sixteenth that of liquid oxygen at \(1141\ \mathrm{kg/m^3}\) and less than a tenth that of kerosene at \(810\ \mathrm{kg/m^3}\) (Wikipedia, “Liquid hydrogen”, “Liquid oxygen”, “RP-1”; see sources). Figure 6.1 plots the four pairs with curves of constant density impulse. By that measure kerosene delivers \(2.7\) times as much impulse per cubic metre of tank as hydrogen does at sea level.
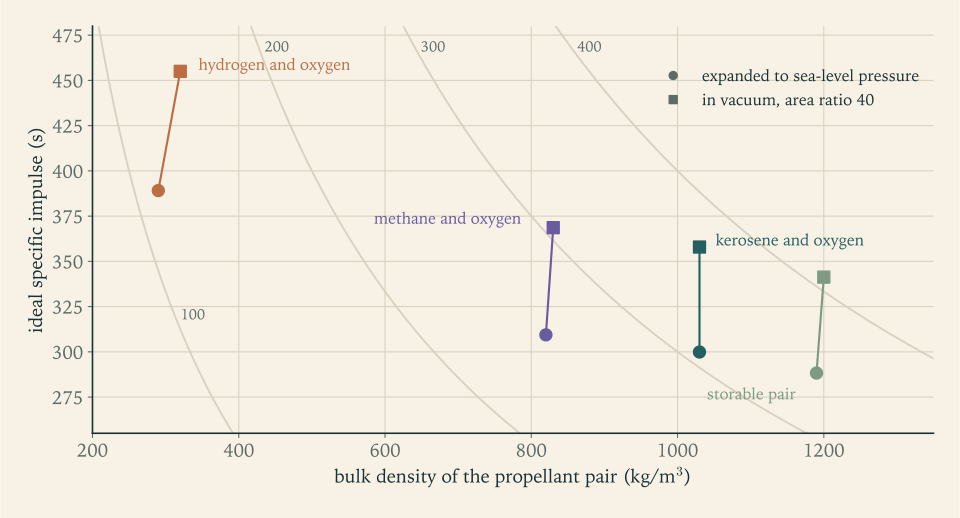
Neither number wins by itself, and the right weighting depends on the stage. Chapter 2 showed that a kilogram of structure on the first stage costs about an eighth of a kilogram of payload, and on the second stage a full kilogram, while a second of specific impulse is worth about the same on either. A first stage is large, so volume is expensive, and its structure is cheap in payload terms; dense propellants suit it. An upper stage is small and every second of specific impulse acts on the final mass ratio; light propellants suit it. The Saturn V, with kerosene below and hydrogen above, followed that logic, and the Falcon 9, with kerosene in both, shows that a single dense propellant with one engine family is a defensible answer too.
Example 6.1: Tanks for the reference launcher
Mixture ratio. Kerosene engines are listed with mixture ratios from \(2.27\) for the F-1 to \(2.72\) for the RD-180, and the tabulated optimum is \(2.58\) at sea level (secondary compilation; see sources). Take \(\mathrm{O/F}=2.3\) (illustrative design value at the fuel-rich end of that range).
Bulk density.
Check against the table. At \(\mathrm{O/F}=2.58\) the same formula gives \(1024\ \mathrm{kg/m^3}\) , against the tabulated \(1030\) ; for hydrogen at \(4.13\) it gives \(289\ \mathrm{kg/m^3}\) against \(290\) . The cited densities and the cited table agree to better than one percent.
Stage 1. The load of \(137\,021\ \mathrm{kg}\) is \(41\,522\ \mathrm{kg}\) of kerosene and \(95\,499\ \mathrm{kg}\) of oxygen:
In a stage \(3.0\ \mathrm m\) in diameter (an illustrative design choice; its cross-section of \(7.07\ \mathrm{m^2}\) is the reference area Chapter 7 uses for drag) that is a column \(19.1\ \mathrm m\) long, of which the oxygen tank is \(11.8\ \mathrm m\) .
Stage 2. \(24\,881\ \mathrm{kg}\) occupies \(24.5\ \mathrm{m^3}\) , a column \(3.47\ \mathrm m\) long at the same diameter.
The same stages with hydrogen. At \(\mathrm{O/F}=6\) the bulk density of hydrogen and oxygen is \(7/(1/70.85+6/1141)=361\ \mathrm{kg/m^3}\) . The first-stage load would need \(379\ \mathrm{m^3}\) , a column \(54\ \mathrm m\) long at this diameter. Of course a hydrogen stage would need less propellant; the next example does that comparison properly.
Example 6.2: A hydrogen upper stage, sized honestly
Question. Replace the reference launcher’s second stage by a hydrogen stage that delivers the same \(\Delta v_2=5068.6\ \mathrm{m/s}\) (the \(5069\ \mathrm{m/s}\) of Revision A, before rounding) to the same \(5000\ \mathrm{kg}\) payload. What changes?
Inputs. The RL10C-1-1, a hydrogen upper-stage engine, is listed at \(453.8\ \mathrm s\) with a mixture ratio of \(5.5\) (Wikipedia, “RL10”; see sources), so \(c=4450.3\ \mathrm{m/s}\) and \(\rho_{\mathrm{bulk}}=6.5/(1/70.85+5.5/1141)=343.3\ \mathrm{kg/m^3}\) . The big, cold tanks are heavier per kilogram of propellant; take \(\varepsilon=0.12\) instead of \(0.08\) (illustrative).
Stage payload fraction. By Proposition 2.1,
against \(0.1560\) for the kerosene stage.
Masses. The stack at second-stage ignition is \(5000/0.22745=21\,983\ \mathrm{kg}\) instead of \(32\,045\ \mathrm{kg}\) . The stage itself is \(16\,983\ \mathrm{kg}\) : \(2038\ \mathrm{kg}\) of structure and \(14\,945\ \mathrm{kg}\) of propellant.
Volume. \(14\,945/343.3=43.5\ \mathrm{m^3}\) , against \(24.5\ \mathrm{m^3}\) : the hydrogen stage carries \(40\) percent less propellant in \(78\) percent more tank.
Effect on the vehicle. The first stage’s job is unchanged in velocity, and its mass scales with what it carries, so the liftoff mass falls in proportion: \(177.8\ \mathrm t\times21\,983/32\,045=122.0\ \mathrm t\) . A hydrogen upper stage would make the whole launcher \(31\) percent lighter.
Why not, then? The comparison left out everything that is not mass: a second propellant with its own ground equipment, an engine family that shares nothing with the first stage, insulation, and a longer vehicle. It also rested on an assumed \(\varepsilon\) ; at \(\varepsilon=0.14\) the saving shrinks to \(26\) percent (Exercise 19). The reference launcher keeps kerosene in both stages, as the contract of this course specifies. The calculation shows what that choice costs.
6.2 The mixture ratio is a choice, and the best choice is fuel-rich
Section 4.6 claimed that exhaust velocity peaks at a mixture with less oxygen than complete combustion needs. A model simple enough to do by hand shows where the peak comes from.
Example 6.3: Hydrogen and oxygen at different mixture ratios
Model. Burn one mole of hydrogen with \(\mathrm{O/F}/16\) moles of oxygen, so that the mass ratio is \(\mathrm{O/F}\) . Assume the oxygen reacts completely and nothing dissociates. The products are then water vapour and leftover hydrogen, one mole in total, with mass \(2+2\,(\mathrm{O/F})\) grams. A set of lecture notes supplies the data: forming a mole of water vapour releases \(57.8\ \mathrm{kcal}\) , and the molar specific heats are about \(10.6\ \mathrm{cal/(mol\cdot K)}\) for water vapour and \(7.5\) for hydrogen (MIT 16.50 notes, Lecture 11; see sources). The energy balance of Section 4.6 gives the chamber temperature. The mixture’s specific heat gives \(\gamma\) through the molar form of Definition 4.5: per mole, the specific heats at constant pressure and constant volume differ by \(R_u\) , so \(\gamma\) is the molar specific heat at constant pressure divided by that value less \(R_u\) . Theorems 5.3 and 4.5 then give \(c^\ast\) and the exit velocity for expansion from \(68\) atmospheres to one.
| \(\mathrm{O/F}\) | \(T_c\) | \(\mathcal M\) | \(\gamma\) | \(T_c/\mathcal M\) | \(c^\ast\) | Exit velocity |
|---|---|---|---|---|---|---|
| \(2\) | \(2044\ \mathrm K\) | \(6\ \mathrm{g/mol}\) | \(1.316\) | \(341\) | \(2512\ \mathrm{m/s}\) | \(3877\ \mathrm{m/s}\) |
| \(3\) | \(2800\ \mathrm K\) | \(8\ \mathrm{g/mol}\) | \(1.298\) | \(350\) | \(2558\ \mathrm{m/s}\) | \(3967\ \mathrm{m/s}\) |
| \(4\) | \(3491\ \mathrm K\) | \(10\ \mathrm{g/mol}\) | \(1.281\) | \(349\) | \(2566\ \mathrm{m/s}\) | \(3997\ \mathrm{m/s}\) |
| \(5\) | \(4126\ \mathrm K\) | \(12\ \mathrm{g/mol}\) | \(1.267\) | \(344\) | \(2557\ \mathrm{m/s}\) | \(3998\ \mathrm{m/s}\) |
| \(6\) | \(4710\ \mathrm K\) | \(14\ \mathrm{g/mol}\) | \(1.254\) | \(336\) | \(2539\ \mathrm{m/s}\) | \(3985\ \mathrm{m/s}\) |
| \(8\) | \(5751\ \mathrm K\) | \(18\ \mathrm{g/mol}\) | \(1.231\) | \(320\) | \(2490\ \mathrm{m/s}\) | \(3936\ \mathrm{m/s}\) |
The column \(T_c/\mathcal M\) is in kelvin per gram per mole.
Reading the table. Complete combustion is at \(\mathrm{O/F}=8\) , the bottom row, and it is the hottest. Of the rows from \(\mathrm{O/F}=3\) upward it is also the worst performer. As oxygen is added the temperature climbs steadily, but each added oxygen molecule turns two light hydrogen molecules into two heavy water molecules, and \(T_c/\mathcal M\) peaks near \(\mathrm{O/F}=3\) . The exit velocity peaks a little later, near \(4.6\) in this model, because the richer mixtures have a higher \(\gamma\) and convert less of their enthalpy at this pressure ratio.
Against published values. The tabulated optimum for this expansion is \(\mathrm{O/F}=4.13\) , with \(T_c=3013\ \mathrm K\) and an exhaust velocity of \(3816\ \mathrm{m/s}\) . The model puts the optimum in the right place and overstates everything else: it has no dissociation, so its temperatures are too high, absurdly so in the bottom rows, and its velocities are about \(5\) percent high.
What engines do. The peak is flat. Between \(\mathrm{O/F}=4\) and \(6\) the model’s exit velocity changes by \(0.3\) percent, while the bulk density rises from \(284\) to \(361\ \mathrm{kg/m^3}\) , more than a quarter. So hydrogen engines run richer in oxygen than the performance optimum, giving up almost nothing in exhaust velocity for much smaller tanks: the RS-25 is listed at \(6.03\) and versions of the RL10 at \(5.5\) and \(5.88\) (secondary compilation; see sources).
The same reasoning applies to kerosene, whose complete combustion needs \(\mathrm{O/F}=3.43\) (Example 3.7) and whose tabulated optimum is \(2.58\) to \(2.77\) . Mixture ratio is therefore a design variable with a flat optimum, set on one side by molar mass and on the other by tank volume.
6.3 Tanks under pressure, or pumps
Propellant flows into the chamber only if it arrives at a pressure above \(p_c\) . There are two ways to arrange that. The simple way is to keep the tanks themselves above chamber pressure with a compressed gas and let the propellant run downhill in pressure. The other is to keep the tanks at low pressure and raise the pressure with a pump just ahead of the engine.
The first way costs tank mass. A thin-walled cylindrical tank of diameter \(d\) and wall thickness \(b_w\) holding pressure \(p\) carries a hoop stress \(\sigma\) that follows from cutting it lengthwise: the pressure force on a unit length, \(p\,d\) , is carried by two walls of thickness \(b_w\) , so \(\sigma=p\,d/(2b_w)\) . For a sphere the cut is a circle: \(p\,\pi d^2/4\) is carried by a ring of area \(\pi d\,b_w\) , so \(\sigma=p\,d/(4b_w)\) .
Proposition 6.1 (mass of a pressure vessel). A thin-walled vessel of volume \(\mathcal V\) holding pressure \(p\) , made of material of density \(\rho_w\) working at stress \(\sigma\) , has shell mass
Proof. For the cylinder of length \(l_{\mathrm{tank}}\) , the shell mass is \(\rho_w\,\pi d\,l_{\mathrm{tank}}\,b_w\) with \(b_w=p\,d/(2\sigma)\) , which is \((2\rho_w p/\sigma)(\pi d^2l_{\mathrm{tank}}/4)\) . For the sphere, the shell mass is \(\rho_w\,\pi d^2\,b_w\) with \(b_w=p\,d/(4\sigma)\) , which is \((3\rho_wp/(2\sigma))(\pi d^3/6)\) .
The result is striking for what is absent. The mass depends on pressure times volume and on the material, and not on the size or number of tanks: ten small tanks weigh the same as one large one of the same total volume. There is no economy of scale in pressure vessels. Dividing by the propellant mass \(\rho_{\mathrm{bulk}}\mathcal V\) , the tank costs a fixed fraction \(2\rho_wp/(\sigma\rho_{\mathrm{bulk}})\) of the propellant it holds. A set of lecture notes gives the same scaling with a factor for the end caps (MIT 16.50 notes, Lecture 16; see sources).
Example 6.4: What pressure-fed tanks would weigh
Material. The aluminium alloy 2219, used for launch-vehicle tanks, has density \(2840\ \mathrm{kg/m^3}\) and a tensile strength listed between \(172\) and \(476\ \mathrm{MPa}\) depending on its treatment (Wikipedia, “2219 aluminium alloy”; see sources). Take a working stress of \(\sigma=300\ \mathrm{MPa}\) (illustrative).
A test case. For \(\mathcal V=100\ \mathrm{m^3}\) at \(p=0.3\ \mathrm{MPa}\) :
At \(12\ \mathrm{MPa}\) , forty times the pressure, the same volume needs \(17.0\ \mathrm t\) as a sphere and \(22.7\ \mathrm t\) as a cylinder.
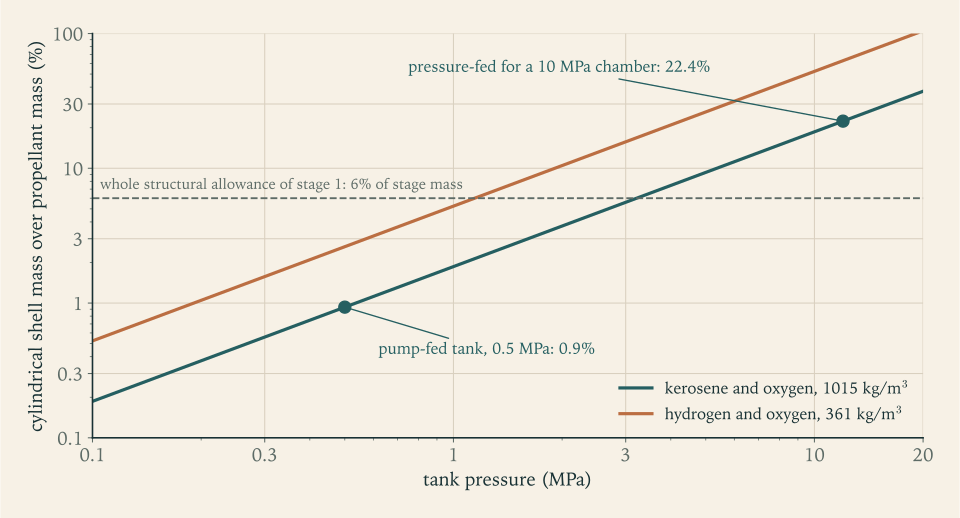
The first stage. For the \(135.0\ \mathrm{m^3}\) of Example 6.1, a cylindrical shell at \(0.5\ \mathrm{MPa}\) weighs \(1278\ \mathrm{kg}\) , less than one percent of the propellant. To feed a \(10\ \mathrm{MPa}\) chamber without pumps the tanks would have to hold about \(12\ \mathrm{MPa}\) , and the shell would weigh \(30.7\ \mathrm t\) , which is \(22\) percent of the propellant and three and a half times the entire structural allowance of the stage. The wall would be \(60\ \mathrm{mm}\) thick.
Check. At \(0.5\ \mathrm{MPa}\) the wall thickness is \(b_w=p\,d/(2\sigma)=(0.5\times10^{6})(3.0)/(600\times10^{6})=2.5\ \mathrm{mm}\) , a plausible sheet gauge for a tank three metres across.
Conclusion. Pressure feeding is ruled out for a large high-pressure stage by a factor of more than twenty in tank mass. It survives where the product \(p\mathcal V\) is small: small stages with low chamber pressure, where the simplicity is worth a modest penalty (Exercise 7). Figure 6.2 shows the scaling.
So the reference launcher needs pumps. What do they cost? A pump is a steady-flow device with a shaft, and Theorem 4.2 applies. For a liquid the density hardly changes, an ideal pump adds no heat, and the speed is similar at inlet and outlet, so the enthalpy rise is all flow work: \(h_2-h_1=(p_2-p_1)/\rho\) . A real pump needs more shaft power than that by the factor \(1/\eta_{\mathrm{pump}}\) .
Proposition 6.2 (pump power). To raise the pressure of a liquid of density \(\rho\) by \(\Delta p\) at mass flow \(\dot m\) , a pump of efficiency \(\eta_{\mathrm{pump}}\) needs shaft power
The factor \(\dot m/\rho\) is the volume flow. Pumping is paid for by the cubic metre, which is the second way a thin propellant hurts.
Example 6.5: Pump power, for the launcher and for real engines
The first stage. The pumps must deliver more than chamber pressure, because the propellant loses pressure in the cooling passages and across the injector. Take a pressure rise of \(\Delta p=15\ \mathrm{MPa}\) for a \(10\ \mathrm{MPa}\) chamber and \(\eta_{\mathrm{pump}}=0.7\) (illustrative). With both propellants raised by the same amount, the volume flow is \(\dot m_1/\rho_{\mathrm{bulk}}\) :
For the second stage’s \(83.60\ \mathrm{kg/s}\) the same calculation gives \(1.76\ \mathrm{MW}\) .
In proportion. Per kilogram of propellant the pump work is \(21.1\ \mathrm{kJ}\) , which is \(0.27\) percent of the chamber enthalpy of \(7.81\ \mathrm{MJ/kg}\) and \(0.54\) percent of the stage’s jet power of \(3.17\ \mathrm{GW}\) . Seventeen megawatts is a large machine, and it is a small tax.
Check against the F-1. That engine is listed with flows of \(1789\ \mathrm{kg/s}\) of oxygen and \(788\ \mathrm{kg/s}\) of kerosene, a chamber pressure of \(7.0\ \mathrm{MPa}\) , and a turbopump of \(41\ \mathrm{MW}\) (Wikipedia, “Rocketdyne F-1”; see sources). The volume flow is \(1789/1141+788/810=2.54\ \mathrm{m^3/s}\) . With the same assumptions, a rise of \(1.5\,p_c=10.5\ \mathrm{MPa}\) and efficiency \(0.7\) , the estimate is \((2.54)(10.5\times10^{6})/0.7=38.1\ \mathrm{MW}\) , within \(7\) percent of the listed power.
Check against a hydrogen engine. The RS-25 is listed with a fuel pump of \(53.1\ \mathrm{MW}\) discharging at \(45\ \mathrm{MPa}\) and an oxygen pump of \(17.3\ \mathrm{MW}\) discharging at \(30\ \mathrm{MPa}\) , at a vacuum thrust of \(2279\ \mathrm{kN}\) , a specific impulse of \(452.3\ \mathrm s\) , and a mixture ratio of \(6.03\) (Wikipedia, “RS-25”; see sources). Its total flow is \(513.8\ \mathrm{kg/s}\) , of which hydrogen is \(73.1\ \mathrm{kg/s}\) . The ideal work for the hydrogen is \((73.1)(45\times10^{6})/70.85=46.4\ \mathrm{MW}\) and for the oxygen \((440.7)(30\times10^{6})/1141=11.6\ \mathrm{MW}\) : of the right size in both cases, and the hydrogen pump takes three times the power of the oxygen pump to move one sixth of the mass.
6.4 Who pays for the pumps
Seventeen megawatts has to come from somewhere, and the only energy on board is in the propellants. An engine cycle is the arrangement by which some of that energy is turned into shaft power. Each cycle is defined by two answers: what drives the turbine, and where the turbine’s exhaust goes. A turbine is the steady-flow energy equation run the other way from a pump: gas at temperature \(T_{\mathrm{in}}\) expanding through a pressure ratio delivers, per kilogram, at most \(c_pT_{\mathrm{in}}\) times the conversion fraction of Section 4.5, and a real turbine delivers a fraction \(\eta_{\mathrm{turb}}\) of that. Turbine blades are uncooled metal, so the gas that drives them must be far cooler than the main chamber’s; it is made by burning at a mixture ratio very far from the optimum.
Gas generator. A small stream of propellant is burned in a separate chamber, sent through the turbine, and dumped overboard at low pressure. The main chamber is unaffected. The price is that the dumped stream produces little thrust, so the engine’s specific impulse is lower than its main chamber’s. The lecture notes cited above list the simple start-up and straightforward development as the advantages and the overboard dump as the disadvantage, with the F-1 among their examples (MIT 16.50 notes, Lecture 16; see sources); the Merlin and the Soyuz upper-stage engine RD-0110 are also listed as gas-generator engines (secondary compilation; see sources).
Staged combustion. All of one propellant, with a little of the other, is burned in a preburner, driven through the turbine, and then injected into the main chamber, where it finishes burning. Nothing is dumped, so there is no loss of specific impulse. But the turbine now exhausts into the main chamber, so its inlet must be well above chamber pressure and the pumps must deliver higher still. The RS-25, with a chamber at \(20.6\ \mathrm{MPa}\) , has pumps discharging at \(30\) and \(45\ \mathrm{MPa}\) . The notes give high chamber pressure and high specific impulse as the advantages, and complexity, cost, and high pump pressures as the disadvantages. The RD-180 and RS-25 are of this type.
Expander. The fuel is heated in the cooling passages of the chamber and nozzle, expands through the turbine, and then enters the chamber. There is no second combustion device at all. The power available is limited to the heat the walls give up, which limits the chamber pressure; the notes give the RL10 as the example.
Electric pump. Batteries drive electric motors on the pump shafts. The Rutherford engine of the Electron launcher works this way, with two motors of \(37\ \mathrm{kW}\) per engine (Wikipedia, “Rutherford (rocket engine)”; see sources). There is no turbine and no dumped gas; the cost is the mass of the batteries.
The gas-generator cycle is the simplest to put numbers on.
Example 6.6: The bleed that drives the first-stage pumps
Turbine work per kilogram. Let the gas generator supply gas at \(T_{\mathrm{in}}=900\ \mathrm K\) , with \(c_p=2500\ \mathrm{J/(kg\cdot K)}\) and \(\gamma=1.2\) , expanding through a pressure ratio of \(20\) in a turbine of efficiency \(\eta_{\mathrm{turb}}=0.6\) (all illustrative). By Theorem 4.2 and Proposition 4.4 the work extracted per kilogram is
Bleed flow. The pumps need \(17.1\ \mathrm{MW}\) , so the turbine needs \(17.1\times10^{6}/531\times10^{3}=32.3\ \mathrm{kg/s}\) , which is \(4.0\) percent of the stage’s \(811.1\ \mathrm{kg/s}\) .
Cost in specific impulse. The turbine exhaust leaves through a small nozzle of its own. If it contributes \(30\) percent of the main exhaust’s effective velocity per kilogram (illustrative), the engine’s specific impulse is the main chamber’s times \(0.96+(0.04)(0.3)\) , a factor of \(0.972\) . The gas generator costs \(2.8\) percent: on the ideal vacuum figure of \(322.9\ \mathrm s\) from Example 5.8, about \(9\ \mathrm s\) .
Check against engines. Section 5.7 found the gas-generator Merlin at \(97.8\) percent of this course’s ideal and the staged-combustion RD-180 at \(100.4\) percent, a difference of \(2.6\) points between two engines burning the same propellants. The estimate here says the cycle alone should account for about \(2.8\) . The agreement should not be pressed. The two engines were compared with the model at very different area ratios, \(165\) and \(36.87\) , and the model’s own error changes with the amount of expansion, so the comparison shows only that a cycle penalty of two to three percent is consistent with the engine data.
Batteries instead? The energy needed is \(17.1\ \mathrm{MW}\) for \(168.9\ \mathrm s\) , which is \(2.89\ \mathrm{GJ}\) . At \(200\ \mathrm{W\cdot h/kg}\) , that is \(0.72\ \mathrm{MJ/kg}\) (an illustrative figure for lithium cells), the batteries weigh \(4.0\ \mathrm t\) , or \(2.9\) percent of the propellant they pump, and unlike the bleed they are still on board at burnout. By the exchange ratios of Example 2.6, \(4.0\ \mathrm t\) of first-stage structure costs about \(530\ \mathrm{kg}\) of payload, while \(2.8\) percent of a first-stage specific impulse near \(309\ \mathrm s\) costs about \(290\ \mathrm{kg}\) . For this stage at this pressure the gas generator is the lighter answer. The battery fraction is proportional to the pressure rise and independent of size, so electric pumps favour engines of modest chamber pressure, where their simplicity counts for most.
The reference launcher’s engines are therefore taken to be gas-generator engines. That choice is one of the things the factor of \(97.5\) percent in Chapter 5 was standing for.
6.5 How hard to push: chamber pressure
Why \(10\ \mathrm{MPa}\) ? Higher chamber pressure helps in two ways. For a nozzle that must hold a given exit pressure, to stay clear of separation on the pad, a higher \(p_c\) means a larger pressure ratio and area ratio, hence more specific impulse both at sea level and in vacuum. And the throat area \(\dot mc^\ast/p_c\) shrinks, so the engine is smaller for the same thrust. Against this, pump power is proportional to \(p_c\) , and with a gas generator so is the bleed.
Example 6.7: The chamber pressure a gas generator can afford
Setup. Hold the first-stage exit pressure at \(65\ \mathrm{kPa}\) , as chosen in Example 5.8, the pump pressure rise at \(1.5\,p_c\) , and the turbine work at \(531\ \mathrm{kJ/kg}\) . For each chamber pressure find the area ratio as in Example 5.4, the ideal vacuum specific impulse from Theorem 5.5, the bleed fraction, and the vacuum specific impulse after charging the bleed as in Example 6.6.
| \(p_c\) | Area ratio | Ideal \(I_{sp}\) , vacuum | Pump power | Bleed fraction | \(I_{sp}\) after bleed, vacuum |
|---|---|---|---|---|---|
| \(5\ \mathrm{MPa}\) | \(9.7\) | \(311.9\ \mathrm s\) | \(8.6\ \mathrm{MW}\) | \(2.0\) percent | \(307.5\ \mathrm s\) |
| \(7\ \mathrm{MPa}\) | \(12.6\) | \(317.5\ \mathrm s\) | \(12.0\ \mathrm{MW}\) | \(2.8\) percent | \(311.3\ \mathrm s\) |
| \(10\ \mathrm{MPa}\) | \(16.5\) | \(322.9\ \mathrm s\) | \(17.1\ \mathrm{MW}\) | \(4.0\) percent | \(313.9\ \mathrm s\) |
| \(15\ \mathrm{MPa}\) | \(22.6\) | \(328.7\ \mathrm s\) | \(25.7\ \mathrm{MW}\) | \(6.0\) percent | \(315.0\ \mathrm s\) |
| \(20\ \mathrm{MPa}\) | \(28.3\) | \(332.5\ \mathrm s\) | \(34.2\ \mathrm{MW}\) | \(8.0\) percent | \(314.0\ \mathrm s\) |
| \(26.7\ \mathrm{MPa}\) | \(35.4\) | \(336.1\ \mathrm s\) | \(45.7\ \mathrm{MW}\) | \(10.6\) percent | \(311.1\ \mathrm s\) |
Reading the table. Without a bleed, the third column, more pressure is always better: from \(10\) to \(26.7\ \mathrm{MPa}\) the ideal vacuum figure gains \(13\ \mathrm s\) . With the bleed charged, the last column, the gain is eaten as fast as it is made. The best value is \(315.0\ \mathrm s\) near \(14\ \mathrm{MPa}\) , and the curve is so flat that \(10\ \mathrm{MPa}\) gives up only \(0.3\) percent of it with a pump two thirds the size.
Against practice. The gas-generator engines cited in this course run at \(6.8\) , \(7.0\) , and \(9.7\ \mathrm{MPa}\) (RD-0110, F-1, Merlin), and the staged-combustion engines at \(20.6\) and \(26.7\ \mathrm{MPa}\) (RS-25, RD-180) (secondary compilation; see sources). The two groups sit on either side of the point where the bleed stops paying, as Figure 6.3 shows.

For staged combustion the limit is different. No specific impulse is lost, but the turbine must extract the pump power from gas that then enters a chamber at \(p_c\) , and the pump power itself rises with the turbine’s pressure ratio. The power balance closes only up to some chamber pressure, which for plausible numbers is a little under \(20\ \mathrm{MPa}\) (Exercise 11).
The other limit on pressure and temperature is heat. The chamber gas is at \(3600\ \mathrm K\) , far above what any structural metal tolerates, and yet the wall survives, because the gas touches it only through a thin layer of slower, cooler gas. The heat flux into the wall is the energy flux of the stream past it, \(\rho u\,c_p(T_c-T_{\mathrm{wall}})\) , times a small dimensionless number, the Stanton number \(\mathrm{St}\) , for which an empirical formula used at nozzle throats is \(\mathrm{St}=0.023\,\mathrm{Re}^{-1/5}\,\mathrm{Pr}^{-0.67}\) , (MIT 16.50 notes, Lecture 14; see sources). Three terms in it are new. The viscosity of a gas measures its resistance to shearing, the property that makes the layer next to the wall slow; its unit is \(\mathrm{Pa\cdot s}\) . The Reynolds number \(\mathrm{Re}\) is the mass flux times the throat diameter divided by the viscosity, a measure of how thin that layer is compared with the throat. The Prandtl number \(\mathrm{Pr}\) is the ratio of the gas’s ability to spread momentum to its ability to spread heat, and is a little under \(1\) for gases. With a viscosity of \(10^{-4}\ \mathrm{Pa\cdot s}\) and \(\mathrm{Pr}=0.8\) (both illustrative), the reference engine’s throat has \(\mathrm{Re}=1.4\times10^{7}\) and \(\mathrm{St}\) of about \(0.001\) , so with the mass flux of \(5685\ \mathrm{kg/(m^2\cdot s)}\) from Example 5.2 and a wall held at \(800\ \mathrm K\) (illustrative),
Only a thousandth of the passing energy enters the wall, and that thousandth is still the power of a small town through each square metre. The same notes observe that the flux is greatest at the throat, where \(\rho u\) is greatest. That heat must be carried off continuously, in most large engines by running the fuel through passages in the wall before it is injected. Two balances set the limit. The fuel can absorb only so much: at \(81.9\ \mathrm{kg/s}\) per engine, with a specific heat near \(2000\ \mathrm{J/(kg\cdot K)}\) and a permissible temperature rise of about \(300\ \mathrm K\) (illustrative), \(49\ \mathrm{MW}\) , which is \(2.3\) percent of the engine’s thermal power. And the flux itself grows with pressure, as \((\rho u)^{0.8}\) by the formula above: at \(26.7\ \mathrm{MPa}\) it is \(2.2\) times larger, \(76\ \mathrm{MW/m^2}\) . The mass flux and with it the heat load scale with chamber pressure, and the wall material and coolant do not. This is what holds chamber pressure and temperature where they are, and it is as far as this course takes the subject.
6.6 A different limit: propulsion with a power supply
Chemical rockets are limited in exhaust velocity because their energy comes from the propellant itself: a fixed number of joules per kilogram, hence \(c\le\sqrt{2q_R}\) (Section 3.8). Separate the energy source from the propellant and that ceiling disappears. An electric thruster takes power from solar panels and uses it to accelerate a small flow of propellant to any speed the designer likes.
The NEXT ion thruster is listed at a thrust of \(237\ \mathrm{mN}\) and a specific impulse of \(4170\ \mathrm s\) for an input of \(6.9\ \mathrm{kW}\) (Wikipedia, “NEXT (ion thruster)”; see sources). Its exhaust velocity is \(40.9\ \mathrm{km/s}\) , eight times the chemical ceiling for hydrogen. Its jet power is \(\tfrac12Fc=4.85\ \mathrm{kW}\) , so it converts \(70\) percent of its electrical input. And its thrust is the weight of a few sheets of paper.
That last fact is not a defect of this thruster. Jet power is \(\dot W_{\mathrm{jet}}=\tfrac12Fc\) , so for a given power
Thrust per watt falls as the exhaust velocity rises. A chemical engine at \(c=3\ \mathrm{km/s}\) gets \(0.67\ \mathrm N\) per kilowatt of jet power and has gigawatts available, because its power is carried in with the propellant at no extra mass. The electric thruster gets \(0.049\ \mathrm N\) per kilowatt and must carry every watt as solar panel. The chemical rocket is energy-limited; the electric one is power-limited.
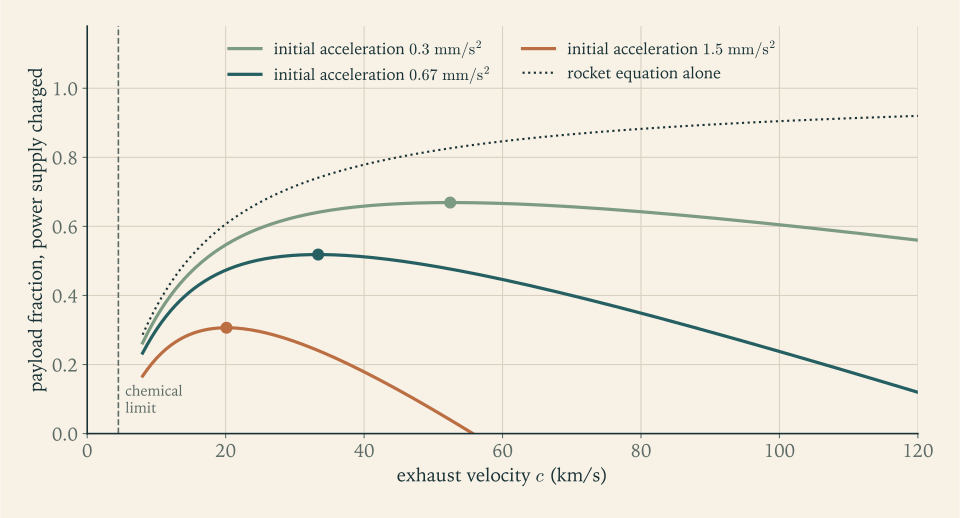
Being power-limited changes the optimization. Let the power supply have mass \(\Lambda\) per watt of jet power, so that its mass is \(\Lambda\,\dot W_{\mathrm{jet}}=\Lambda Fc/2\) . As a fraction of the initial mass \(m_0\) this is \(\Lambda\,\psi_0g_0\,c/2\) , where \(\psi_0g_0=F/m_0\) is the initial acceleration. If the supply is the only dead mass, the payload fraction for a mission of ideal velocity \(\Delta v\) is
The first term is the rocket equation and rises with \(c\) . The second is new and falls with \(c\) : a faster exhaust needs a heavier power supply for the same thrust. So an electric stage has an optimum exhaust velocity, which a chemical stage does not. Setting the derivative with respect to \(c\) to zero gives the condition
Example 6.8: An electric stage, checked against a published example
Setup. A set of lecture notes considers a mission of \(\Delta v=10\ \mathrm{km/s}\) with a power supply of \(20\ \mathrm{kg/kW}\) , that is \(\Lambda=0.020\ \mathrm{kg/W}\) , and chooses \(\Delta v/c=0.3\) (MIT 16.50 notes, Lecture 5; see sources).
Exhaust velocity and acceleration. \(c=10\,000/0.3=33.3\ \mathrm{km/s}\) . The optimum condition gives
a thrust-to-weight ratio of \(6.8\times10^{-5}\) .
Payload fraction. \(e^{-0.3}-0.0667/0.3=0.741-0.222=0.519\) .
Burn time. The propellant fraction is \(1-e^{-0.3}=0.259\) and it is consumed at the rate \(F/c\) , so \(t_b=(c/\psi_0g_0)(1-e^{-0.3})=1.30\times10^{7}\ \mathrm s\) , which is \(150\) days.
Comparison with the source. The notes round the right side of the optimum condition to \(0.07\) , and report an acceleration of \(7\times10^{-4}\ \mathrm{m/s^2}\) , a payload fraction of \(0.5\) , and a time of \(142\) days. The same notes give \(0.0084\) as the payload fraction of a single hydrogen and oxygen stage with ten percent structure for this mission.
Meaning. Half of the initial mass arrives as payload after \(10\ \mathrm{km/s}\) , sixty times what one chemical stage manages, and it takes five months of continuous thrust at less than a ten-thousandth of the vehicle’s weight. Electric propulsion is superb once in orbit and useless for getting there: a launcher needs \(\psi_0\) above \(1\) , and this one is short by four orders of magnitude. Figure 6.4 shows the optimum.
6.7 Where the structural coefficient comes from
Chapter 2 took \(\varepsilon_1=0.06\) and \(\varepsilon_2=0.08\) on trust. The pieces are now available for a first estimate from the bottom up. The mass of a stage that is not usable propellant has three parts: tanks, sized by pressure and volume; engines, sized by thrust; and everything else.
Tanks. A pump-fed tank needs enough pressure to keep the pump inlets supplied and the thin shell stable, a few tenths of a megapascal, plus the weight of the liquid column under acceleration. For the first stage’s oxygen tank, \(11.8\ \mathrm m\) tall at liftoff under \(1.3\,g_0\) , the column adds \((1141)(1.3)(9.807)(11.8)\ \mathrm{Pa}=0.17\ \mathrm{MPa}\) at the bottom. A design pressure of \(0.5\ \mathrm{MPa}\) covers both. The shell of Proposition 6.1 carries pressure only. A real tank also has end domes, joints, stiffening against the compression and bending that the stage carries in flight, and internal baffles; allow a factor of \(2\) on the shell mass (illustrative).
Engines. Engine mass is thrust divided by the engine’s own thrust-to-weight ratio \(\psi_{\mathrm{eng}}=F/(m_{\mathrm{eng}}g_0)\) . Listed values for kerosene engines range from \(74\) for the RD-0110 and \(78\) for the RD-180 through \(94\) for the F-1 to \(184\) for the Merlin 1D (secondary compilation; see sources).
Everything else. A structure to spread the engine thrust into the tank walls, feed lines, the interstage, wiring, guidance, the gas that pressurizes the tanks and the bottles that hold it, and the propellant that is loaded but cannot be burned: reserves, and the residue left in lines and tank bottoms. None of these scales simply, and several do not scale at all, which matters for small stages.
Example 6.9: A first mass estimate for both stages
Stage 1. Propellant \(137\,021\ \mathrm{kg}\) in \(135.0\ \mathrm{m^3}\) ; sea-level thrust \(2267\ \mathrm{kN}\) .
| Item | Basis | Mass |
|---|---|---|
| Tanks | twice the cylindrical shell at \(0.5\ \mathrm{MPa}\) , \(2\times1278\ \mathrm{kg}\) | \(2555\ \mathrm{kg}\) |
| Engines | \(\psi_{\mathrm{eng}}=100\) (illustrative): \(2267\ \mathrm{kN}/(100\,g_0)\) | \(2312\ \mathrm{kg}\) |
| Thrust structure and feed lines | \(25\) percent of engine mass (illustrative) | \(578\ \mathrm{kg}\) |
| Interstage | allowance (illustrative) | \(350\ \mathrm{kg}\) |
| Avionics and wiring | allowance (illustrative) | \(150\ \mathrm{kg}\) |
| Pressurization | \(65\ \mathrm{kg}\) of helium plus bottles | \(257\ \mathrm{kg}\) |
| Residual propellant | \(1\) percent of the load (illustrative) | \(1370\ \mathrm{kg}\) |
| Total | \(7571\ \mathrm{kg}\) |
The pressurization line is physics. Filling \(135\ \mathrm{m^3}\) at \(0.3\ \mathrm{MPa}\) and \(300\ \mathrm K\) takes \(p\mathcal V\mathcal M/(R_uT)=65\ \mathrm{kg}\) of helium. Stored at high pressure, the gas has the same product \(p\mathcal V\) , so by Proposition 6.1 a metal sphere to hold it weighs \((3/2)(\rho_w/\sigma)(40.5\ \mathrm{MJ})=575\ \mathrm{kg}\) whatever the storage pressure. Fibre-wound bottles do better; one third of the metal figure is assumed (illustrative).
The structural coefficient is \(\varepsilon_1=7571/(7571+137\,021)=0.052\) .
Stage 2. Propellant \(24\,881\ \mathrm{kg}\) in \(24.5\ \mathrm{m^3}\) ; vacuum thrust \(282.8\ \mathrm{kN}\) . The tanks are short, so the liquid column adds little and \(0.35\ \mathrm{MPa}\) would do, but the wall would then be \(1.75\ \mathrm{mm}\) thick. Sheet thinner than about \(2\ \mathrm{mm}\) is hard to weld and handle at this diameter (an illustrative minimum gauge), so the tank is built as if for \(0.4\ \mathrm{MPa}\) .
| Item | Basis | Mass |
|---|---|---|
| Tanks | twice the cylindrical shell at \(0.4\ \mathrm{MPa}\) | \(371\ \mathrm{kg}\) |
| Engine | \(\psi_{\mathrm{eng}}=74.4\) , the RD-0110’s listed value | \(388\ \mathrm{kg}\) |
| Thrust structure and feed lines | \(25\) percent of engine mass | \(97\ \mathrm{kg}\) |
| Avionics, guidance, batteries | allowance (illustrative) | \(250\ \mathrm{kg}\) |
| Payload adapter and separation | allowance (illustrative) | \(100\ \mathrm{kg}\) |
| Attitude control for coasting | allowance (illustrative) | \(50\ \mathrm{kg}\) |
| Pressurization | \(12\ \mathrm{kg}\) of helium plus bottles | \(47\ \mathrm{kg}\) |
| Residual and reserve propellant | \(1.5\) percent of the load (illustrative) | \(373\ \mathrm{kg}\) |
| Total | \(1676\ \mathrm{kg}\) |
The structural coefficient is \(\varepsilon_2=1676/(1676+24\,881)=0.063\) .
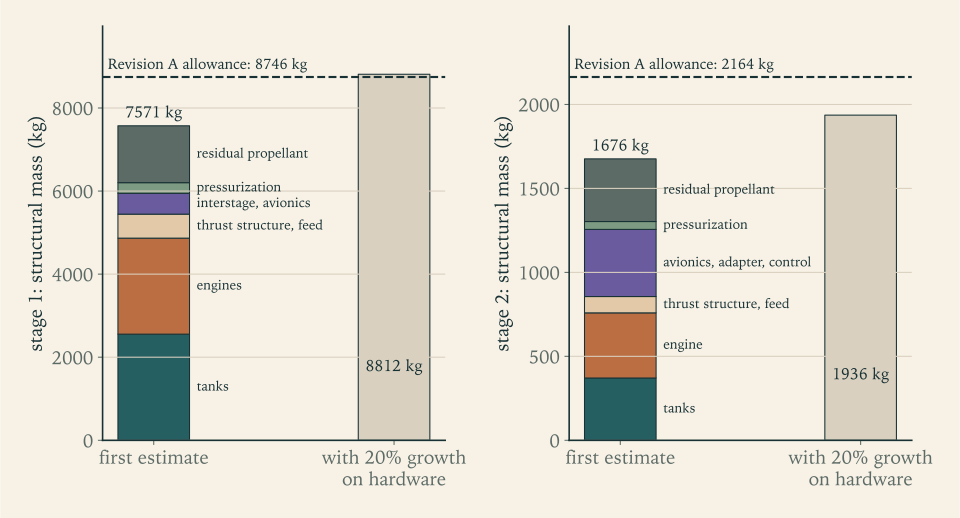
Growth. First estimates are low, because they contain only what the estimator thought of. Adding \(20\) percent to the hardware lines, and not to the propellant residue, which is a different kind of quantity (an illustrative allowance), gives \(8812\ \mathrm{kg}\) and \(1936\ \mathrm{kg}\) , hence
How much of this is assumption. Two illustrative factors carry the result: the factor of \(2\) on tank shell mass and the \(20\) percent growth. With neither, the same tables give \(\varepsilon_1=0.044\) and \(\varepsilon_2=0.057\) ; the two factors together move those to \(0.060\) and \(0.072\) . Among the other lines, only the shell mass, the pressurant, and the second-stage engine rest on physics or on cited data; the rest are allowances. So this is an estimate with judgment in it and not a derivation, and its agreement with any target is only as good as those two factors.
Against real stages. The Falcon 9 first stage has \(\varepsilon=0.051\) and its much larger second stage \(0.036\) (Chapter 2). The Soyuz-2 core stage, of an older design, is listed with an empty mass of \(6545\ \mathrm{kg}\) and a gross mass of \(99\,765\ \mathrm{kg}\) , so \(\varepsilon=0.066\) . The closest real relative of the reference second stage is the Soyuz-2 third stage: \(25\,400\ \mathrm{kg}\) of kerosene and oxygen, one RD-0110 engine of \(298\ \mathrm{kN}\) , a diameter of \(2.66\ \mathrm m\) , and an empty mass of \(2355\ \mathrm{kg}\) in a gross mass of \(27\,755\ \mathrm{kg}\) , which is \(\varepsilon=0.085\) (Wikipedia, “Soyuz-2” and “RD-0110”; see sources).
Verdict. For the first stage, the estimate with both allowances lands on the assumed \(0.06\) . Because that depends on the two illustrative factors, it shows that \(0.06\) is reachable with plausible allowances, not that it is right. The stronger evidence is that real stages of similar size bracket it, at \(0.051\) and \(0.066\) . For the second stage the estimate with growth, \(0.072\) , is under the assumed \(0.08\) , but the one real stage of the same size is over it at \(0.085\) . Hardware outranks a first estimate. The honest statement is that \(0.08\) is plausible for a modern stage and has no margin, and that each coefficient is uncertain by about \(0.01\) .
Figure 6.5 shows both estimates against their allowances.
Why the coefficient cannot be driven toward zero is now visible in the tables. Tank mass is a fixed fraction of propellant mass, set by a pressure that cannot go to zero and a material that cannot be infinitely strong. Engine mass is a fixed fraction of thrust, and thrust must exceed the stage’s weight. Those two floors alone come to about \(3.5\) percent of the propellant mass for the first stage. The remainder is a list of small necessities, and on a small stage the ones that do not scale, such as guidance, are a large share. In the second-stage table the three fixed allowances are \(400\ \mathrm{kg}\) of \(1676\ \mathrm{kg}\) . Add \(300\ \mathrm{kg}\) of fixed equipment to each stage and \(\varepsilon_1\) moves by \(0.002\) while \(\varepsilon_2\) moves by \(0.010\) (Exercise 17).
Common mistake. Quoting the structural coefficient of a large modern stage for a small one. The Falcon 9 second stage’s \(0.036\) belongs to a stage with \(107\ \mathrm t\) of propellant. A stage a quarter that size carries the same guidance, the same adapter, and tank walls that cannot be made a quarter as thick.
6.8 The launcher’s inputs, justified
The two kinds of number that Chapter 2 assumed can now be stated with their origin and their uncertainty.
| Input | Value | Where it comes from | Real comparison | Uncertainty |
|---|---|---|---|---|
| Stage 1 \(I_{sp}\) , sea level and vacuum | \(285\) and \(315\ \mathrm s\) | \(97.5\) percent of the model ideal at \(p_c=10\ \mathrm{MPa}\) , area ratio \(16.5\) , gas-generator cycle | Merlin 1D: \(282\) and \(311\ \mathrm s\) | \(+2\) to \(-6\ \mathrm s\) |
| Stage 2 \(I_{sp}\) | \(345\ \mathrm s\) | \(97.5\) percent of the model ideal at area ratio \(140\) | Merlin Vacuum: \(348\ \mathrm s\) at area ratio \(165\) | about \(\pm5\ \mathrm s\) |
| \(\varepsilon_1\) | \(0.06\) | mass estimate: \(0.044\) to \(0.060\) , depending on two illustrative allowances | \(0.051\) and \(0.066\) | \(\pm0.01\) |
| \(\varepsilon_2\) | \(0.08\) | mass estimate: \(0.057\) to \(0.072\) , depending on the same allowances | \(0.085\) for the same size; \(0.036\) for four times the size | \(\pm0.01\) |
The first-stage specific impulses are about one percent above those quoted for the Merlin, an engine of the same cycle and nearly the same chamber pressure. Given the two gaps described in Section 5.7, that is within what the model can resolve, but the error is not symmetric: the comparable real engine says these inputs are more likely \(3\) to \(4\ \mathrm s\) too high than too low, and the range in the table is skewed to say so. By Example 2.6, \(4\ \mathrm s\) on the first stage is worth about \(140\ \mathrm{kg}\) of payload. An increase of \(0.01\) in \(\varepsilon_2\) with the propellant load fixed is \(297\ \mathrm{kg}\) of second-stage structure, hence about \(300\ \mathrm{kg}\) of payload. These, and not the third significant figure of any calculation, are the real uncertainties of the design.
New numbers produced in this chapter, all for the propellant loads and thrusts of Revision A:
| Quantity | Stage 1 | Stage 2 |
|---|---|---|
| Mixture ratio and bulk density | \(2.3\) , \(1015\ \mathrm{kg/m^3}\) | \(2.3\) , \(1015\ \mathrm{kg/m^3}\) |
| Tank volume | \(135.0\ \mathrm{m^3}\) | \(24.5\ \mathrm{m^3}\) |
| Tank column at \(3.0\ \mathrm m\) diameter | \(19.1\ \mathrm m\) | \(3.47\ \mathrm m\) |
| Pump power | \(17.1\ \mathrm{MW}\) | \(1.76\ \mathrm{MW}\) |
| Engines | three, each \(755.6\ \mathrm{kN}\) at sea level and \(771\ \mathrm{kg}\) | one, \(282.8\ \mathrm{kN}\) and \(388\ \mathrm{kg}\) |
| Estimated structural mass, with growth | \(8812\ \mathrm{kg}\) | \(1936\ \mathrm{kg}\) |
| Structural mass assumed in Revision A | \(8746\ \mathrm{kg}\) | \(2164\ \mathrm{kg}\) |
Three items are still missing from the vehicle. No payload fairing has been counted; a shell \(3\ \mathrm m\) across and \(6\ \mathrm m\) long at \(10\ \mathrm{kg/m^2}\) would be about \(570\ \mathrm{kg}\) (illustrative), carried through the atmosphere and then dropped; no revision carries it until Revision C in Chapter 12. The propellant reserves are a guess. And the first-stage engines’ vacuum thrust gives \(6.3\,g_0\) at burnout; Chapter 7 prices a limit on it. With tanks, engine bays, an interstage, and a fairing, the vehicle is about \(37\ \mathrm m\) long and \(3.0\ \mathrm m\) across.
The propulsion arc ends here. Its outcome is that Revision A’s propulsion and structure inputs stand: none of \(I_{sp,1}\) , \(I_{sp,2}\) , \(\varepsilon_1\) , or \(\varepsilon_2\) needs to change, each now has an estimate, a real comparison, and an error bar behind it, and the first stage has gained a sea-level and a vacuum value in place of one average. The sizes in the last table are another matter. They follow the propellant loads and thrusts, and those will change: tank volume and pump power in proportion to propellant and flow, engine mass in proportion to thrust, while the fixed items stay as they are. What does not yet have a derivation is the largest input of all, the provisional \(9.4\ \mathrm{km/s}\) the vehicle is asked to deliver. That number depends on how the vehicle climbs and where it is going: how long it fights gravity, how hard it pushes through the air, how much of its thrust is spent turning, and what the orbit itself demands. Chapters 7 to 9 derive it, and Chapter 9 reissues the vehicle as Revision B.
Exercises
-
Name the properties by which a propellant pair is judged, define bulk density and density impulse, and explain in terms of \(T_c/\mathcal M\) why the mixture ratio that gives the highest exhaust velocity contains more fuel than complete combustion requires.
-
Methane and oxygen at their sea-level optimum have a tabulated bulk density of \(820\ \mathrm{kg/m^3}\) and an ideal exhaust velocity of \(3034\ \mathrm{m/s}\) (Wikipedia, “Liquid rocket propellant”; see sources). (a) Find the tank volume and the column length at \(3.0\ \mathrm m\) diameter for the reference first stage’s \(137\,021\ \mathrm{kg}\) of propellant, and compare with kerosene. (b) Compute the density impulse of both pairs from the table of Section 6.1. (c) Say which pair is better by each of the two measures.
Answer
(a) \(\mathcal V=137\,021/820=167.1\ \mathrm{m^3}\) , a column \(23.6\ \mathrm m\) long, against \(135.0\ \mathrm{m^3}\) and \(19.1\ \mathrm m\) for kerosene: \(24\) percent more. (b) With sea-level exhaust velocities, \(I_{sp}\) is \(309.4\ \mathrm s\) for methane and \(299.9\ \mathrm s\) for kerosene, so the density impulses are \((820)(309.4)=2.54\times10^{5}\) and \((1030)(299.9)=3.09\times10^{5}\ \mathrm{kg\cdot s/m^3}\) . (c) Methane is better by specific impulse, by \(3\) percent; kerosene is better by density impulse, by \(22\) percent.
-
Derive the bulk-density formula of Definition 6.1 from the volumes occupied by fuel and oxidizer. Evaluate it for kerosene and oxygen at the F-1’s mixture ratio of \(2.27\) and the RD-180’s \(2.72\) , and show that the result always lies between the two liquid densities and approaches each in the appropriate limit.
Solution
Take \(1\ \mathrm{kg}\) of fuel and the \(\mathrm{O/F}\) kilograms of oxidizer that burn with it. Their masses add to \(1+\mathrm{O/F}\) . Their volumes also add, since the two liquids are stored in separate tanks: the fuel occupies \(1/\rho_{\mathrm{fuel}}\) and the oxidizer \((\mathrm{O/F})/\rho_{\mathrm{ox}}\) . Bulk density is total mass over total volume, which is the formula of Definition 6.1.
For kerosene at \(810\ \mathrm{kg/m^3}\) and oxygen at \(1141\ \mathrm{kg/m^3}\) :
\[ \rho_{\mathrm{bulk}}(2.27)=\frac{3.27}{\dfrac1{810}+\dfrac{2.27}{1141}}=1014\ \mathrm{kg/m^3},\qquad \rho_{\mathrm{bulk}}(2.72)=\frac{3.72}{\dfrac1{810}+\dfrac{2.72}{1141}}=1028\ \mathrm{kg/m^3}. \]The whole range of mixture ratios used by real kerosene engines changes the bulk density by little more than one percent, because the two liquids are not very different in density.
To see that the result lies between the two densities, write the reciprocal: \(1/\rho_{\mathrm{bulk}}\) is the average of \(1/\rho_{\mathrm{fuel}}\) and \(1/\rho_{\mathrm{ox}}\) with weights \(1/(1+\mathrm{O/F})\) and \(\mathrm{O/F}/(1+\mathrm{O/F})\) , the mass fractions of fuel and oxidizer. A weighted average with positive weights lies between the quantities averaged, so \(1/\rho_{\mathrm{bulk}}\) lies between the two reciprocals and \(\rho_{\mathrm{bulk}}\) between the two densities. As \(\mathrm{O/F}\to0\) the fuel’s weight tends to \(1\) and \(\rho_{\mathrm{bulk}}\to\rho_{\mathrm{fuel}}\) ; as \(\mathrm{O/F}\to\infty\) the oxidizer’s weight tends to \(1\) and \(\rho_{\mathrm{bulk}}\to\rho_{\mathrm{ox}}\) .
-
A designer proposes to rebuild the reference first stage with hydrogen and oxygen: effective \(I_{sp}\) of \(430\ \mathrm s\) instead of \(300\ \mathrm s\) , structural coefficient \(0.10\) instead of \(0.06\) , bulk density \(362\ \mathrm{kg/m^3}\) (illustrative values). The stage must still supply \(\Delta v_1=4331\ \mathrm{m/s}\) to the \(32\,045\ \mathrm{kg}\) stack above it. (a) Find the stage payload fraction for both propellants. (b) Find the liftoff mass and the propellant mass of the hydrogen version. (c) Find its tank volume and compare with the kerosene stage’s \(135.0\ \mathrm{m^3}\) . (d) Give two reasons, not captured by this arithmetic, why the gain is smaller in practice.
Solution
(a) By Proposition 2.1 the stage payload fraction is \((e^{-\Delta v/c}-\varepsilon)/(1-\varepsilon)\) . For kerosene, \(c=2942\ \mathrm{m/s}\) :
\[ \pi_1=\frac{e^{-4331/2942}-0.06}{0.94}=\frac{0.2294-0.06}{0.94}=0.1802 . \]For hydrogen, \(c=(430)(9.80665)=4217\ \mathrm{m/s}\) :
\[ \pi_1=\frac{e^{-4331/4217}-0.10}{0.90}=\frac{0.35806-0.10}{0.90}=0.2867 . \](b) The liftoff mass is \(32\,045/0.2867=111.8\ \mathrm t\) , against \(177.8\ \mathrm t\) . The stage is \(111.8-32.0=79.7\ \mathrm t\) , of which \(90\) percent, \(71.7\ \mathrm t\) , is propellant.
(c) \(71\,740/362=198\ \mathrm{m^3}\) , against \(135.0\ \mathrm{m^3}\) : the stage is \(37\) percent lighter at liftoff and needs \(47\) percent more tank volume.
(d) The arithmetic assumed a structural coefficient of \(0.10\) , and Figure 6.2 shows hydrogen tanks cost three times as much mass per kilogram of propellant, before insulation; a real value could be worse. The larger body also has more drag per unit mass in the dense lower atmosphere, which this chapter has not counted. Beyond those two: pumping hydrogen takes far more power per kilogram, so the engines are heavier for their thrust, and first-stage structure is the cheapest mass on the vehicle, so the first stage is where a high specific impulse is worth least relative to what it costs.
-
In the model of Example 6.3, one mole of hydrogen burns with \(\mathrm{O/F}/16\) moles of oxygen, the chamber temperature is \(298\ \mathrm K+115\,600\,n/(7.5+6.2\,n)\ \mathrm K\) with \(n=\mathrm{O/F}/16\) , and the products have molar mass \((2+32n)\ \mathrm{g/mol}\) . (a) Explain where the term \(32n\) comes from. (b) Compute \(T_c\) , \(\mathcal M\) , and \(T_c/\mathcal M\) for \(\mathrm{O/F}=4\) , \(6\) , and \(8\) . (c) Compute the bulk density at \(\mathrm{O/F}=4\) and \(6\) . (d) Use (b) and (c) to explain why hydrogen engines run near \(6\) .
Solution
(a) One mole of hydrogen, \(2\ \mathrm g\) , reacts with \(n\) moles of oxygen, \(32n\) grams. The products are \(2n\) moles of water and \(1-2n\) moles of hydrogen, one mole in total whatever \(n\) is, with all of the mass: \(2+32n\) grams. So each mole of oxygen adds \(32\ \mathrm g\) to the mass of one mole of products.
(b) With \(n=\mathrm{O/F}/16\) :
\[ \mathrm{O/F}=4:\ T_c=298+\frac{(115\,600)(0.25)}{9.05}=3491\ \mathrm K,\quad \mathcal M=10\ \mathrm{g/mol},\quad T_c/\mathcal M=349 ; \]\[ \mathrm{O/F}=6:\ T_c=298+\frac{(115\,600)(0.375)}{9.825}=4710\ \mathrm K,\quad \mathcal M=14\ \mathrm{g/mol},\quad T_c/\mathcal M=336 ; \]\[ \mathrm{O/F}=8:\ T_c=298+\frac{(115\,600)(0.5)}{10.6}=5751\ \mathrm K,\quad \mathcal M=18\ \mathrm{g/mol},\quad T_c/\mathcal M=320 , \]with \(T_c/\mathcal M\) in kelvin per gram per mole. The ratio falls as oxygen is added, although the temperature rises by more than \(2000\ \mathrm K\) .
(c) \(\rho_{\mathrm{bulk}}(4)=5/(1/70.85+4/1141)=284\ \mathrm{kg/m^3}\) and \(\rho_{\mathrm{bulk}}(6)=7/(1/70.85+6/1141)=361\ \mathrm{kg/m^3}\) .
(d) From \(\mathrm{O/F}=4\) to \(6\) the ratio \(T_c/\mathcal M\) falls by \(3.6\) percent, so \(\sqrt{T_c/\mathcal M}\) and with it the exhaust velocity fall by under \(2\) percent, and Example 6.3 shows that the full calculation loses even less. The bulk density meanwhile rises by \(27\) percent, shrinking every tank on the stage. A small loss in exhaust velocity buys a large saving in structure, so the best mixture ratio for the vehicle is richer in oxygen than the best for the engine alone.
-
Using Proposition 6.1, (a) show that \(N\) identical spherical tanks holding a given total volume at a given pressure have the same total mass for every \(N\) ; (b) explain why this means a pressure-fed stage gains nothing by scale; (c) name one practical effect that breaks the result for very small tanks and one that breaks it for very long tanks standing upright under acceleration.
Solution
(a) Each of \(N\) spheres holds \(\mathcal V/N\) at pressure \(p\) , so by Proposition 6.1 each has mass \(\tfrac32(\rho_w/\sigma)\,p\,\mathcal V/N\) , and the total is \(\tfrac32(\rho_w/\sigma)\,p\,\mathcal V\) , with no dependence on \(N\) . Geometrically: a sphere of smaller diameter needs a proportionally thinner wall for the same stress, and its surface area per unit volume is proportionally larger, and the two effects cancel.
(b) The tank mass is a fixed fraction, \(\tfrac32\rho_wp/(\sigma\rho_{\mathrm{bulk}})\) for spheres, of the propellant mass, whether the stage holds one tonne or a thousand. A larger pressure-fed stage therefore has the same tank fraction as a smaller one, and since the pressure is set by the chamber the fraction cannot be reduced by building bigger.
(c) For very small tanks the computed wall becomes too thin to make and handle, so a minimum gauge applies and the tank is heavier than the formula says; Example 6.9 met this on the second stage. For very long upright tanks the pressure at the bottom includes the weight of the liquid column under acceleration, which grows with length, so the lower wall must be thicker and the tank is again heavier than the formula says. Scale is neutral only between those two limits.
-
The reference second stage holds \(24.5\ \mathrm{m^3}\) of propellant. Suppose it were pressure-fed, with tank pressure equal to \(1.3\) times chamber pressure, and compare with pump-fed tanks at \(0.4\ \mathrm{MPa}\) . Using the cylindrical-shell formula with \(\rho_w=2840\ \mathrm{kg/m^3}\) and \(\sigma=300\ \mathrm{MPa}\) : (a) find the added shell mass per megapascal of tank pressure; (b) find the chamber pressure at which the pressure-fed design adds \(500\ \mathrm{kg}\) ; (c) say what such a low chamber pressure does to the size of a vacuum engine of fixed thrust and area ratio, and what it does not do to its ideal vacuum specific impulse.
Solution
(a) The cylindrical shell has mass \(2(\rho_w/\sigma)\,p\,\mathcal V\) , so each megapascal adds
\[ 2\cdot\frac{2840}{300\times10^{6}}\,(1\times10^{6})(24.5)=464\ \mathrm{kg} . \](b) An extra \(500\ \mathrm{kg}\) corresponds to \(500/464=1.08\ \mathrm{MPa}\) above the pump-fed tank’s \(0.4\ \mathrm{MPa}\) , a tank pressure of \(1.48\ \mathrm{MPa}\) and so a chamber pressure of \(1.48/1.3=1.14\ \mathrm{MPa}\) .
(c) The throat area is \(\dot mc^\ast/p_c\) , so at \(1.14\ \mathrm{MPa}\) instead of \(10\ \mathrm{MPa}\) the throat and, at the same area ratio, the exit are \(8.8\) times larger in area: an exit \(4.8\ \mathrm m\) across instead of \(1.62\ \mathrm m\) , which does not fit a \(3.0\ \mathrm m\) stage. A pressure-fed version would have to accept a much smaller area ratio. What the low pressure does not change, in the ideal model, is the vacuum specific impulse at a given area ratio: \(c^\ast\) depends on the chamber gas and \(C_{F,\mathrm{vac}}\) on \(\gamma\) and the area ratio, and neither contains \(p_c\) . That is why pressure-fed engines are found on small upper stages and spacecraft: in vacuum the penalty for low chamber pressure is engine size, not exhaust velocity.
-
The reference first stage pumps \(245.8\ \mathrm{kg/s}\) of kerosene and \(565.3\ \mathrm{kg/s}\) of oxygen through a pressure rise of \(15\ \mathrm{MPa}\) at efficiency \(0.7\) . Compute the power of each pump separately, confirm that they sum to the \(17.1\ \mathrm{MW}\) of Example 6.5, and explain why the fuel pump takes \(38\) percent of the power for \(30\) percent of the mass.
Answer
Kerosene: \((245.8)(15\times10^{6})/((810)(0.7))=6.50\ \mathrm{MW}\) . Oxygen: \((565.3)(15\times10^{6})/((1141)(0.7))=10.62\ \mathrm{MW}\) . Sum: \(17.12\ \mathrm{MW}\) . Pump power goes with volume flow, and a kilogram of kerosene occupies \(1141/810=1.41\) times the volume of a kilogram of oxygen.
-
The RS-25 is listed with a vacuum thrust of \(2279\ \mathrm{kN}\) , a specific impulse of \(452.3\ \mathrm s\) , a mixture ratio of \(6.03\) , a fuel pump of \(53.05\ \mathrm{MW}\) discharging at \(45\ \mathrm{MPa}\) , and an oxidizer pump of \(17.34\ \mathrm{MW}\) discharging at \(30\ \mathrm{MPa}\) (Wikipedia, “RS-25”; see sources). (a) Find the hydrogen and oxygen flows. (b) Find the ideal pump work for each, taking the discharge pressure as the pressure rise. (c) Find the efficiency each listed power would imply, and say why the value for hydrogen should not be taken at face value. (d) Compute the pump power per kilogram per second for each propellant and explain the ratio.
Solution
(a) The total flow is thrust over effective exhaust velocity:
\[ \dot m=\frac{2.279\times10^{6}\ \mathrm N}{(452.3\ \mathrm s)(9.80665\ \mathrm{m/s^2})}=513.8\ \mathrm{kg/s}. \]At a mixture ratio of \(6.03\) the hydrogen is \(513.8/7.03=73.1\ \mathrm{kg/s}\) and the oxygen \(440.7\ \mathrm{kg/s}\) .
(b) By Proposition 6.2 with efficiency \(1\) : hydrogen, \((73.1)(45\times10^{6})/70.85=46.4\ \mathrm{MW}\) ; oxygen, \((440.7)(30\times10^{6})/1141=11.6\ \mathrm{MW}\) .
(c) The implied efficiencies are \(46.4/53.05=0.87\) for the fuel pump and \(11.6/17.34=0.67\) for the oxidizer pump. The oxygen figure is of the expected size. The hydrogen figure is too good to believe as it stands, for two reasons that push in opposite directions: the pressure rise across this pump is less than the discharge pressure, because a separate low-pressure pump feeds it, and liquid hydrogen is appreciably compressible at \(45\ \mathrm{MPa}\) , so the constant-density formula is not exact for it.
(d) Per kilogram per second, the hydrogen pump takes \(53.05/73.1=0.726\ \mathrm{MW}\) and the oxygen pump \(17.34/440.7=0.039\ \mathrm{MW}\) , a ratio of \(18\) . Proposition 6.2 says the work per kilogram is \(\Delta p/(\rho\,\eta_{\mathrm{pump}})\) . The pressure rises differ by \(1.5\) and the densities by \(16\) , giving \(24\) ; the efficiencies implied in (c) bring that down to \(18\) . The density is the dominant factor: hydrogen is expensive to pump because a kilogram of it is fourteen litres.
-
A report states: “The gas-generator engine has a lower specific impulse than the staged-combustion engine because its combustion is less complete, as its lower characteristic velocity shows.” Explain why this confuses two things, state what a gas generator does and does not change, and compute the specific impulse of an engine whose main chamber gives \(322.9\ \mathrm s\) when \(4\) percent of the flow is dumped at \(30\) percent of the main exhaust velocity.
Answer
Characteristic velocity and cycle are separate matters. \(c^\ast\) describes the main chamber, and a gas generator does not touch the main chamber: the same propellants burn there at the same mixture ratio and pressure. What the cycle changes is the fraction of the total flow that passes through the main chamber and nozzle at all. With \(4\) percent dumped at \(30\) percent of the main exhaust velocity the specific impulse is \(322.9\times[0.96+(0.04)(0.3)]=322.9\times0.972=313.9\ \mathrm s\) . A lower measured \(c^\ast\) , if there is one, has its own causes and is not explained by the cycle.
-
In an oxidizer-rich staged-combustion kerosene engine, all of the oxygen (\(2.3/3.3\) of the flow) passes through the turbine at \(800\ \mathrm K\) with \(c_p=1100\ \mathrm{J/(kg\cdot K)}\) and \(\gamma=1.3\) , expanding through a pressure ratio of \(1.8\) at efficiency \(0.7\) (illustrative values). The pumps must deliver \(1.2\) times the turbine inlet pressure, hence \(1.2\times1.8\times p_c\) , at efficiency \(0.7\) with bulk density \(1015\ \mathrm{kg/m^3}\) . (a) Find the turbine work per kilogram of total propellant. (b) Find the pump work per kilogram as a multiple of \(p_c\) . (c) Find the largest \(p_c\) at which the power balance closes. (d) Explain why raising the turbine pressure ratio does not raise this limit indefinitely.
Solution
(a) The turbine is a steady-flow device with a shaft, so by Theorem 4.2 and Proposition 4.4 its work per kilogram of turbine gas is \(\eta_{\mathrm{turb}}c_pT_{\mathrm{in}}[1-(1/1.8)^{(\gamma-1)/\gamma}]\) . With \((\gamma-1)/\gamma=0.2308\) , \(1.8^{-0.2308}=0.8732\) :
\[ (0.7)(1100)(800)(0.1268)=78.1\ \mathrm{kJ/kg}. \]Only \(2.3/3.3=0.697\) of the propellant passes through the turbine, so per kilogram of total propellant the turbine supplies \(54.5\ \mathrm{kJ}\) .
(b) By Proposition 6.2 the pump work per kilogram is \(\Delta p/(\rho\,\eta_{\mathrm{pump}})\) with \(\Delta p=(1.2)(1.8)p_c=2.16\,p_c\) :
\[ \frac{2.16\,p_c}{(1015)(0.7)}=3.04\times10^{-3}\,p_c\ \ \mathrm{J/kg},\ \text{with } p_c \text{ in pascals}. \](c) The balance closes when turbine work equals pump work: \(p_c=54.5\times10^{3}/(3.04\times10^{-3})=17.9\ \mathrm{MPa}\) . Above that pressure the turbine, at this inlet temperature and pressure ratio, cannot drive the pumps.
(d) A larger turbine pressure ratio extracts more work per kilogram, but the factor \(1-\mathrm{(ratio)}^{-0.2308}\) grows ever more slowly and can never exceed \(1\) , while the pump’s required pressure rise grows in direct proportion to the ratio. The quotient of the two has a maximum, at a pressure ratio of about \(2.5\) for these numbers, where the limit is \(19.4\ \mathrm{MPa}\) . Beyond it, raising the pressure ratio lowers the attainable chamber pressure. To go higher the engine needs a hotter turbine inlet, more efficient machinery, or more of the flow through the turbine. The RD-180’s \(26.7\ \mathrm{MPa}\) shows that real hardware does better than these illustrative values.
-
The Rutherford engine gives \(24.9\ \mathrm{kN}\) at sea level with \(I_{sp}=311\ \mathrm s\) and has two pump motors of \(37\ \mathrm{kW}\) ; the first stage of its launcher carries nine engines, burns for about \(155\ \mathrm s\) , and lifts off at \(13\,000\ \mathrm{kg}\) (Wikipedia, “Rutherford (rocket engine)”, and Electron Payload User’s Guide; see sources). Assume pump efficiency \(0.7\) , bulk density \(1015\ \mathrm{kg/m^3}\) , and batteries of \(200\ \mathrm{W\cdot h/kg}\) (illustrative). (a) Find the engine’s mass flow and the pump pressure rise that \(74\ \mathrm{kW}\) can supply. (b) Find the battery mass for the nine pumps over the burn, and its share of liftoff mass. (c) Show that battery mass per unit propellant mass is \(\Delta p/(\rho\,\eta_{\mathrm{pump}}\times0.72\ \mathrm{MJ/kg})\) and evaluate it for this engine and for the reference launcher.
Solution
(a) \(\dot m=24.9\times10^{3}/((311)(9.80665))=8.16\ \mathrm{kg/s}\) . Rearranging Proposition 6.2, the pressure rise that \(74\ \mathrm{kW}\) of shaft power can supply is
\[ \Delta p=\frac{\dot W_{\mathrm{pump}}\,\rho\,\eta_{\mathrm{pump}}}{\dot m}=\frac{(74\times10^{3})(1015)(0.7)}{8.16}=6.4\ \mathrm{MPa} , \]which suggests a chamber pressure of a few megapascals, well below the reference launcher’s.
(b) Nine engines take \((9)(74)=666\ \mathrm{kW}\) , and over \(155\ \mathrm s\) that is \(103\ \mathrm{MJ}\) . At \(0.72\ \mathrm{MJ/kg}\) the cells weigh \(143\ \mathrm{kg}\) , which is \(1.1\) percent of the \(13\,000\ \mathrm{kg}\) liftoff mass. The source says the first-stage battery can supply over \(1\ \mathrm{MW}\) , so the real pack has margin over this estimate for losses in the motors and their electronics.
(c) The energy to pump one kilogram of propellant is \(\Delta p/(\rho\,\eta_{\mathrm{pump}})\) , and a battery of specific energy \(0.72\ \mathrm{MJ/kg}\) stores that in a mass \(\Delta p/(\rho\,\eta_{\mathrm{pump}}\times0.72\ \mathrm{MJ/kg})\) . For this engine, \(6.4\times10^{6}/((1015)(0.7)(0.72\times10^{6}))=1.3\) percent of the propellant mass; for the reference launcher at \(15\ \mathrm{MPa}\) , \(2.9\) percent. The fraction contains no measure of size. It is set by the pressure rise, which is why electric pumping suits engines of low chamber pressure.
-
(Computation.) Write a program that reproduces the table of Example 6.7 and finds, by a one-dimensional search, the chamber pressure that maximizes vacuum specific impulse after the bleed is charged. Report the optimum and its specific impulse, then repeat with the turbine work per kilogram doubled, and explain the direction in which the optimum moves.
Answer
The table of Example 6.7 is reproduced. The optimum is at \(p_c=14.4\ \mathrm{MPa}\) with \(315.0\ \mathrm s\) . With the turbine work doubled to \(1061\ \mathrm{kJ/kg}\) , the bleed per megapascal halves and the optimum moves up to \(25.4\ \mathrm{MPa}\) with \(323.7\ \mathrm s\) . Anything that makes the turbine gas more valuable, a hotter inlet or a better turbine, or that recovers the dumped gas, pushes the best chamber pressure higher; in the limit of no bleed there is no optimum and the limit is set by the power balance and by cooling.
-
For the reference engine’s throat, take \(\mathrm{St}=0.001\) at \(p_c=10\ \mathrm{MPa}\) and the scaling of heat flux with \((\rho u)^{0.8}\) . (a) Recompute the throat heat flux at \(10\ \mathrm{MPa}\) and at \(26.7\ \mathrm{MPa}\) for a wall at \(800\ \mathrm K\) . (b) Find the temperature difference across a wall \(1\ \mathrm{mm}\) thick with thermal conductivity \(350\ \mathrm{W/(m\cdot K)}\) (illustrative, a copper alloy) in each case, using flux equals conductivity times temperature difference over thickness. (c) Say which of the two results, total heat or local flux, is the tighter constraint at high pressure.
Hint
(a) The flux is \(\mathrm{St}\,\rho u\,c_p(T_c-T_{\mathrm{wall}})\) : \(34.5\ \mathrm{MW/m^2}\) at \(10\ \mathrm{MPa}\) . At \(26.7\ \mathrm{MPa}\) the mass flux is \(2.67\) times larger and the flux \(2.67^{0.8}=2.19\) times larger, \(75.7\ \mathrm{MW/m^2}\) . (b) Temperature difference equals flux times thickness over conductivity: \(99\ \mathrm K\) and \(216\ \mathrm K\) . (c) For fixed thrust the wetted area shrinks as \(1/p_c\) while the flux grows as \(p_c^{0.8}\) , so the total heat falls slightly with pressure. Think about which quantity the wall material has to survive.
-
The NEXT thruster is listed at \(237\ \mathrm{mN}\) , \(4170\ \mathrm s\) , and \(6.9\ \mathrm{kW}\) (Wikipedia, “NEXT (ion thruster)”; see sources). (a) Find its exhaust velocity, mass flow, jet power, and efficiency. (b) A \(1000\ \mathrm{kg}\) spacecraft carries \(100\ \mathrm{kg}\) of propellant for it; find the velocity change and the thrusting time. (c) Find the propellant a chemical thruster of \(I_{sp}=220\ \mathrm s\) would need for the same velocity change. (d) State what the electric thruster costs in exchange.
Solution
(a) The exhaust velocity is \(c=(4170)(9.80665)=40\,894\ \mathrm{m/s}\) . The mass flow is \(F/c=0.237/40\,894=5.80\times10^{-6}\ \mathrm{kg/s}\) , under six milligrams per second. The jet power is \(\tfrac12Fc=\tfrac12(0.237)(40\,894)=4846\ \mathrm W\) , and the efficiency is \(4846/6900=0.70\) .
(b) The rocket equation applies as for any engine:
\[ \Delta v=c\,\ln\frac{1000}{900}=(40\,894)(0.10536)=4309\ \mathrm{m/s}. \]The propellant lasts \(100/(5.80\times10^{-6})=1.73\times10^{7}\ \mathrm s\) , which is \(200\) days of continuous thrust.
(c) A chemical thruster with \(c=(220)(9.80665)=2157\ \mathrm{m/s}\) would need a mass ratio of \(e^{4309/2157}=7.37\) , so of a \(1000\ \mathrm{kg}\) spacecraft \(864\ \mathrm{kg}\) would be propellant, against \(100\ \mathrm{kg}\) .
(d) Time and power. The manoeuvre takes \(200\) days instead of minutes, and the thruster needs \(6.9\ \mathrm{kW}\) for all of it, which means a solar array and its structure sized for that load. At \(20\ \mathrm{kg/kW}\) that supply would weigh about \(140\ \mathrm{kg}\) , more than the propellant.
-
For a power-limited stage, (a) derive the optimum condition of Section 6.6 by differentiating the payload fraction with respect to \(c\) ; (b) solve it numerically for \(\Lambda\psi_0g_0\Delta v/2=0.02\) and give \(\Delta v/c\) , the payload fraction, and, for \(\Delta v=10\ \mathrm{km/s}\) , the exhaust velocity; (c) explain why the left side of the condition has a maximum value of \(4e^{-2}=0.54\) and what happens to the payload well before that value is reached.
Answer
(a) Differentiate \(e^{-\Delta v/c}-\Lambda\psi_0g_0c/2\) with respect to \(c\) : \((\Delta v/c^2)e^{-\Delta v/c}-\Lambda\psi_0g_0/2=0\) ; multiply by \(\Delta v\) . (b) \(\Delta v/c=0.1526\) , so \(c=65.5\ \mathrm{km/s}\) , and the payload fraction is \(e^{-0.1526}-0.02/0.1526=0.727\) . (c) The function \(X^2e^{-X}\) of \(X=\Delta v/c\) has its maximum at \(X=2\) . At the optimum the payload fraction equals \(e^{-X}(1-X)\) , which is already zero at \(X=1\) , where the right side is \(e^{-1}=0.37\) . A mission demanding more than that carries no payload at any exhaust velocity; it has to accept a lower acceleration or find a lighter power supply.
-
Chapter 2 assumed \(\varepsilon_1=0.06\) and \(\varepsilon_2=0.08\) . (a) After the estimate of Example 6.9, which assumption is more likely to be optimistic, and what evidence decides it? (b) Add a fixed \(300\ \mathrm{kg}\) of equipment to each stage’s first estimate and recompute both coefficients. (c) Use the result to explain why the answer to (a) is not “the first stage, because it is bigger”.
Solution
(a) The second stage. The bottom-up estimate with growth gives \(0.072\) , under the assumed \(0.08\) , but the only real stage of the same size and propellants in the sources, the Soyuz-2 third stage, has \(0.085\) . For the first stage both the estimate (\(0.060\) ) and the real stages (\(0.051\) and \(0.066\) ) straddle the assumption. When a first estimate and flown hardware disagree, the hardware is the better guide, because the estimate omits whatever the estimator did not list.
(b) Adding \(300\ \mathrm{kg}\) to each first estimate:
\[ \varepsilon_1=\frac{7871}{7871+137\,021}=0.0543,\qquad \varepsilon_2=\frac{1976}{1976+24\,881}=0.0736 , \]up from \(0.0524\) and \(0.0631\) . The same \(300\ \mathrm{kg}\) moves the first-stage coefficient by \(0.002\) and the second-stage coefficient by \(0.010\) .
(c) Size works against the small stage, not the large one. The parts of a stage that scale with it, tanks with propellant and engines with thrust, cost the same fraction at any size. The parts that do not scale, such as guidance, wiring, the payload adapter, and a minimum wall gauge, are divided by a propellant mass that is five and a half times smaller on the second stage. An unforeseen fixed item therefore damages \(\varepsilon_2\) five times as much as \(\varepsilon_1\) , and by Example 2.6 each kilogram of it costs a full kilogram of payload instead of an eighth.
-
This exercise uses Chapter 2. Suppose the second stage’s structural coefficient turns out to be \(0.10\) instead of \(0.08\) . (a) If the vehicle is already built with its propellant loads fixed, find the added structural mass and the payload lost. (b) If the vehicle is redesigned for the same payload, use the design sensitivity \(\partial J/\partial\varepsilon_2=5.88\) at the Revision A optimum to estimate the new liftoff mass. (c) State which answer a programme manager needs before the design is frozen and which after.
Solution
(a) With the propellant load fixed at \(m_{p,2}=24\,881\ \mathrm{kg}\) , the structure is \(m_{s,2}=\varepsilon_2m_{p,2}/(1-\varepsilon_2)\) . At \(0.08\) this is \(2164\ \mathrm{kg}\) ; at \(0.10\) it is \((0.10)(24\,881)/0.90=2765\ \mathrm{kg}\) . The stage is \(601\ \mathrm{kg}\) heavier, and by the exchange ratio of Example 2.6 second-stage structure trades one for one with payload: the payload falls from \(5000\) to about \(4400\ \mathrm{kg}\) , a loss of \(12\) percent.
(b) By Proposition 2.6 the logarithm of liftoff mass per unit payload changes by \((\partial J/\partial\varepsilon_2)\,\delta\varepsilon_2=(5.88)(0.02)=0.118\) , so the liftoff mass grows by the factor \(e^{0.118}=1.125\) , from \(177.8\ \mathrm t\) to about \(200\ \mathrm t\) . This is a first-order estimate; the sensitivity itself grows with \(\varepsilon_2\) , so the true figure is somewhat larger.
(c) Before the design is frozen the question is how large the vehicle must be, and (b) answers it: every hundredth of \(\varepsilon_2\) costs six percent of liftoff mass. After the tanks are built the question is what the vehicle can carry, and (a) answers it. The same uncertainty in one coefficient is a \(22\ \mathrm t\) growth in one setting and a \(600\ \mathrm{kg}\) payload loss in the other.
-
Repeat Example 6.2 with a structural coefficient of \(0.14\) for the hydrogen stage. Find the stage payload fraction, the stack mass at second-stage ignition, the propellant volume, and the liftoff mass, and state the structural coefficient at which the hydrogen stage would give no saving in liftoff mass at all.
Answer
\(\pi_2=(0.32016-0.14)/0.86=0.2095\) ; stack at second-stage ignition \(23\,868\ \mathrm{kg}\) ; propellant \(16\,226\ \mathrm{kg}\) in \(47.3\ \mathrm{m^3}\) ; liftoff mass \(132.4\ \mathrm t\) , a saving of \(26\) percent. The saving vanishes when \(\pi_2\) falls to the kerosene stage’s \(0.1560\) : \(0.32016-\varepsilon=0.1560(1-\varepsilon)\) , so \(\varepsilon=0.194\) . A hydrogen upper stage would have to be more than twice as heavily built as the kerosene one before it stopped paying, which is why the propellant is used on upper stages despite its tanks.
-
The reference launcher’s tanks form columns of \(19.1\ \mathrm m\) and \(3.47\ \mathrm m\) at \(3.0\ \mathrm m\) diameter. Allow \(2.5\ \mathrm m\) for each engine bay, \(3\ \mathrm m\) for the interstage, and \(6\ \mathrm m\) for the fairing (illustrative). (a) Estimate the vehicle’s length and its ratio of length to diameter. (b) Compare that ratio with \(70\ \mathrm m\) by \(3.66\ \mathrm m\) for the Falcon 9 and \(18\ \mathrm m\) by \(1.2\ \mathrm m\) for Electron (user’s guides; see sources). (c) Find the diameter at which the reference launcher would have a ratio of \(15\) , keeping the \(14\ \mathrm m\) of fixed lengths.
Answer
(a) \(19.1+3.47+2(2.5)+3+6=36.6\ \mathrm m\) ; length over diameter \(12.2\) . (b) Falcon 9: \(70/3.66=19.1\) . Electron: \(18/1.2=15.0\) . The reference launcher is stubbier than either. (c) The tank columns scale inversely with the square of the diameter. Solving \(\bigl[(22.56)(3.0/d)^2+14\bigr]/d=15\) gives \(d=2.74\ \mathrm m\) and a length of \(41.1\ \mathrm m\) . A slimmer vehicle has less frontal area for drag and is more flexible in bending; Chapters 7 and 11 take up both.